
Interactive Data Ranges for ImageSC Plots
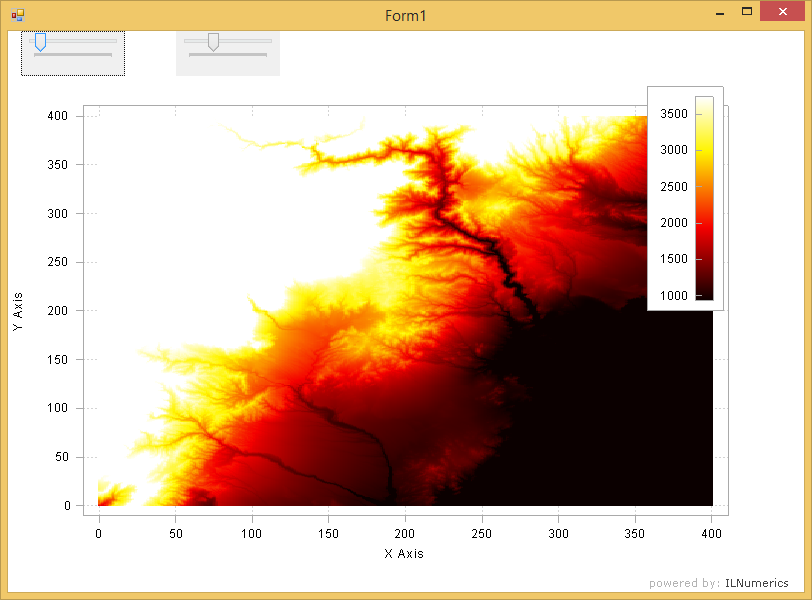
This example creates an ImageSC plot with a colorbar and two slider controls. The sliders are used to determine the lower and upper range of the data which correspond to the lower and upper color range of the colormap. Moving one slider immediately cause the imagesc plot to update its colors. The colorbar updates its range.
Last modified: August 25 2021 18:29