
2D objects in 3d space
In this section we will introduce you to the third dimension by implementing 2D objects in 3D space.
This tutorial contains interactive web components, where you can code in C# and experiment with what you have learned. Here, you can find more information.
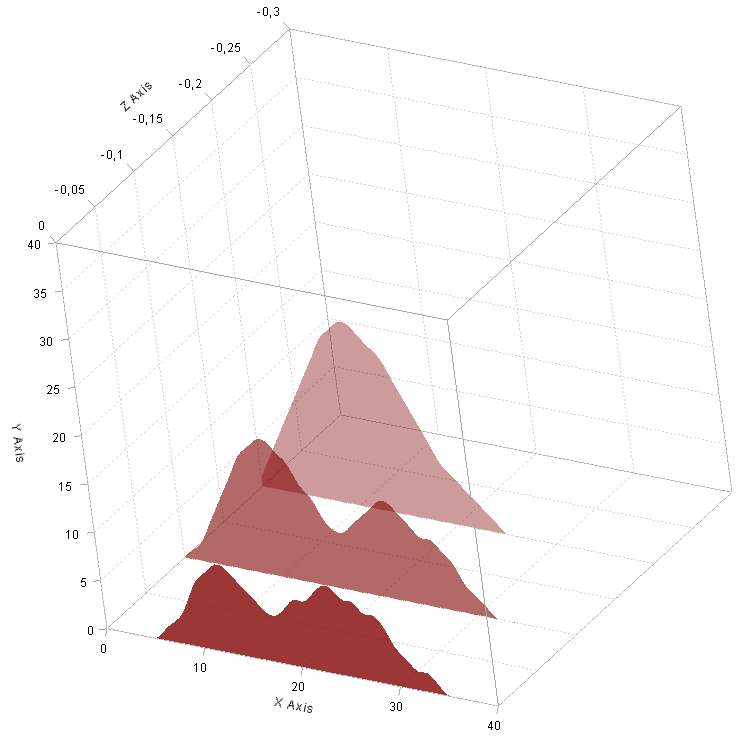
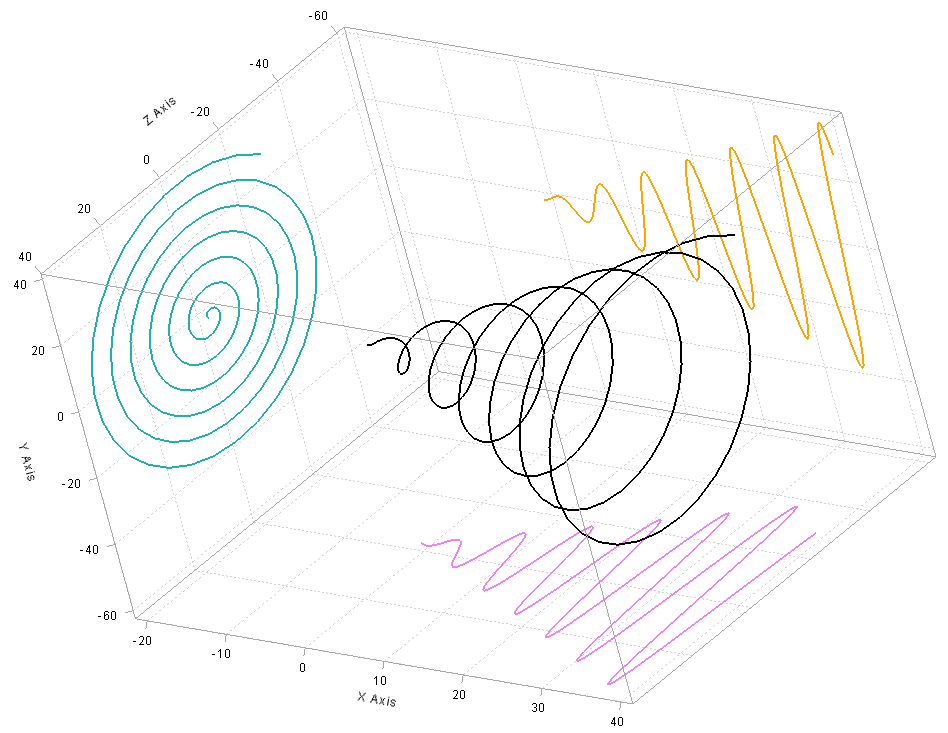
While the example on the left displays a stacked area plot, the one on the right shows a three dimensional line plot and its two dimensional shadows. At first glance those two graphs do not have too much in common but soon we will see that they are both based on a very special visualization class.
In ILNumerics area plots can be created by using the built-in visualization class FillArea(). However, this class only generates two dimensional plots. In order to place or rotate area plots in three dimensional space, we have to fall back on the built-in visualization class Group(). Group() serves as base class for custom visualization objects but also holds and manages group nodes such as FillArea(). Group() exhibits the property Children, allowing to add an arbitrary number of visualization objects. One of the advantages of grouping visualization objects is, that you do not have to translate every single one. Instead you can translate the whole group, while distances between the objects of the group remain preserved.
So let's learn more about how we particularly use Group() for our case:
Don't let those many numbers distract you. As usual, we started by generating data we wish to visualize. After the plot cube is added, the interesting part starts: Since we wanted to create exactly three area plots, we implemented a loop with three iteration steps. First, we created an Group() object. By applying the method Translate(), we can reposition it anywhere in the three dimensional space. Here, only the Z component is different from 0 and dependent on the loop variable. This way the area plot created at a highter iteration step will be further away. Next, we created an FillArea() object and provided it with data. After making small configurations at the visibility of the border and the opacity of the fill color, we added the group to the plotCube. Finally, we changed the size of the plotCube. To change the view, you may uncomment the command at the bottom. By providing different values, you can rotate the view as you wish.
As shown in the code section below, the example containing the spiral is also based on the visualization class Group(). In order to create the two dimensional shadows, always one specific component is set to an array containing constant values.
It is important for you to understand, that all visualization classes are based on Group() and composed of low level shapes. You may use them inside or outside plot cubes, as well as in 2D and 3D scenes.
Read more
The following webpages provide more details on the topics mentioned above: