
The ILNumerics Visualization Engine
The data Visualization Engine of ILNumerics adds sophisticated 2D and 3D visualizations to your .NET applications in C# and Visual Basic. Create production ready plots and graphs from your data with our plotting templates or custom design your graphs according to your needs. We offer a wide range of plotting options including 2D and 3D data visualizations with high and low level objects available. Our advanced interactive plots allow you to use graphs as GUIs that seamlessly integrate with the .NET framework.
Made for Professionals
A quick 2D plot is simple to create. Just take a panel, draw some lines as axis and print some labels for ticks, right? Why would one require a whole 'Engine' for it?
There are several plotting libraries out there. The majority is only dealing with 2D data, though. While it may be enough for a start, many projects require to handle more complex data at some point. To be limited to only 2 dimensions can be a showstopper. Further, professional solution must be able to handle large data, various shapes, NaN values efficiently and robustly.
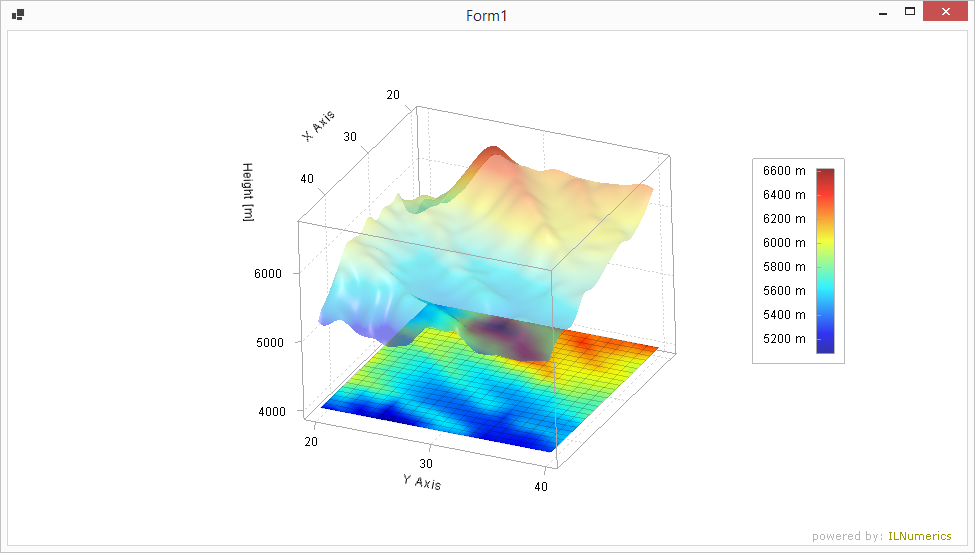
ILNumerics offers 3 dimensions if required, is able to plot logarithmic axes, is fully configurable and interactive. It handles all nifty details for you: mouse interaction, programmable updates, transparent memory management by sharing buffers. Its feature set was extended and improved over 15 years. It incorporates the feedback from thousands of user projects.
Flexible Visualizations for Complex Data
Our Visualization Engine is built on a full-featured scene graph that allows you to quickly implement complex data visualizations. The intuitive object oriented design of the Visualization Engine includes high-level as well as low-level visualization objects. Rendering supports hardware accelerated OpenGL, GDI+ and SVG output.
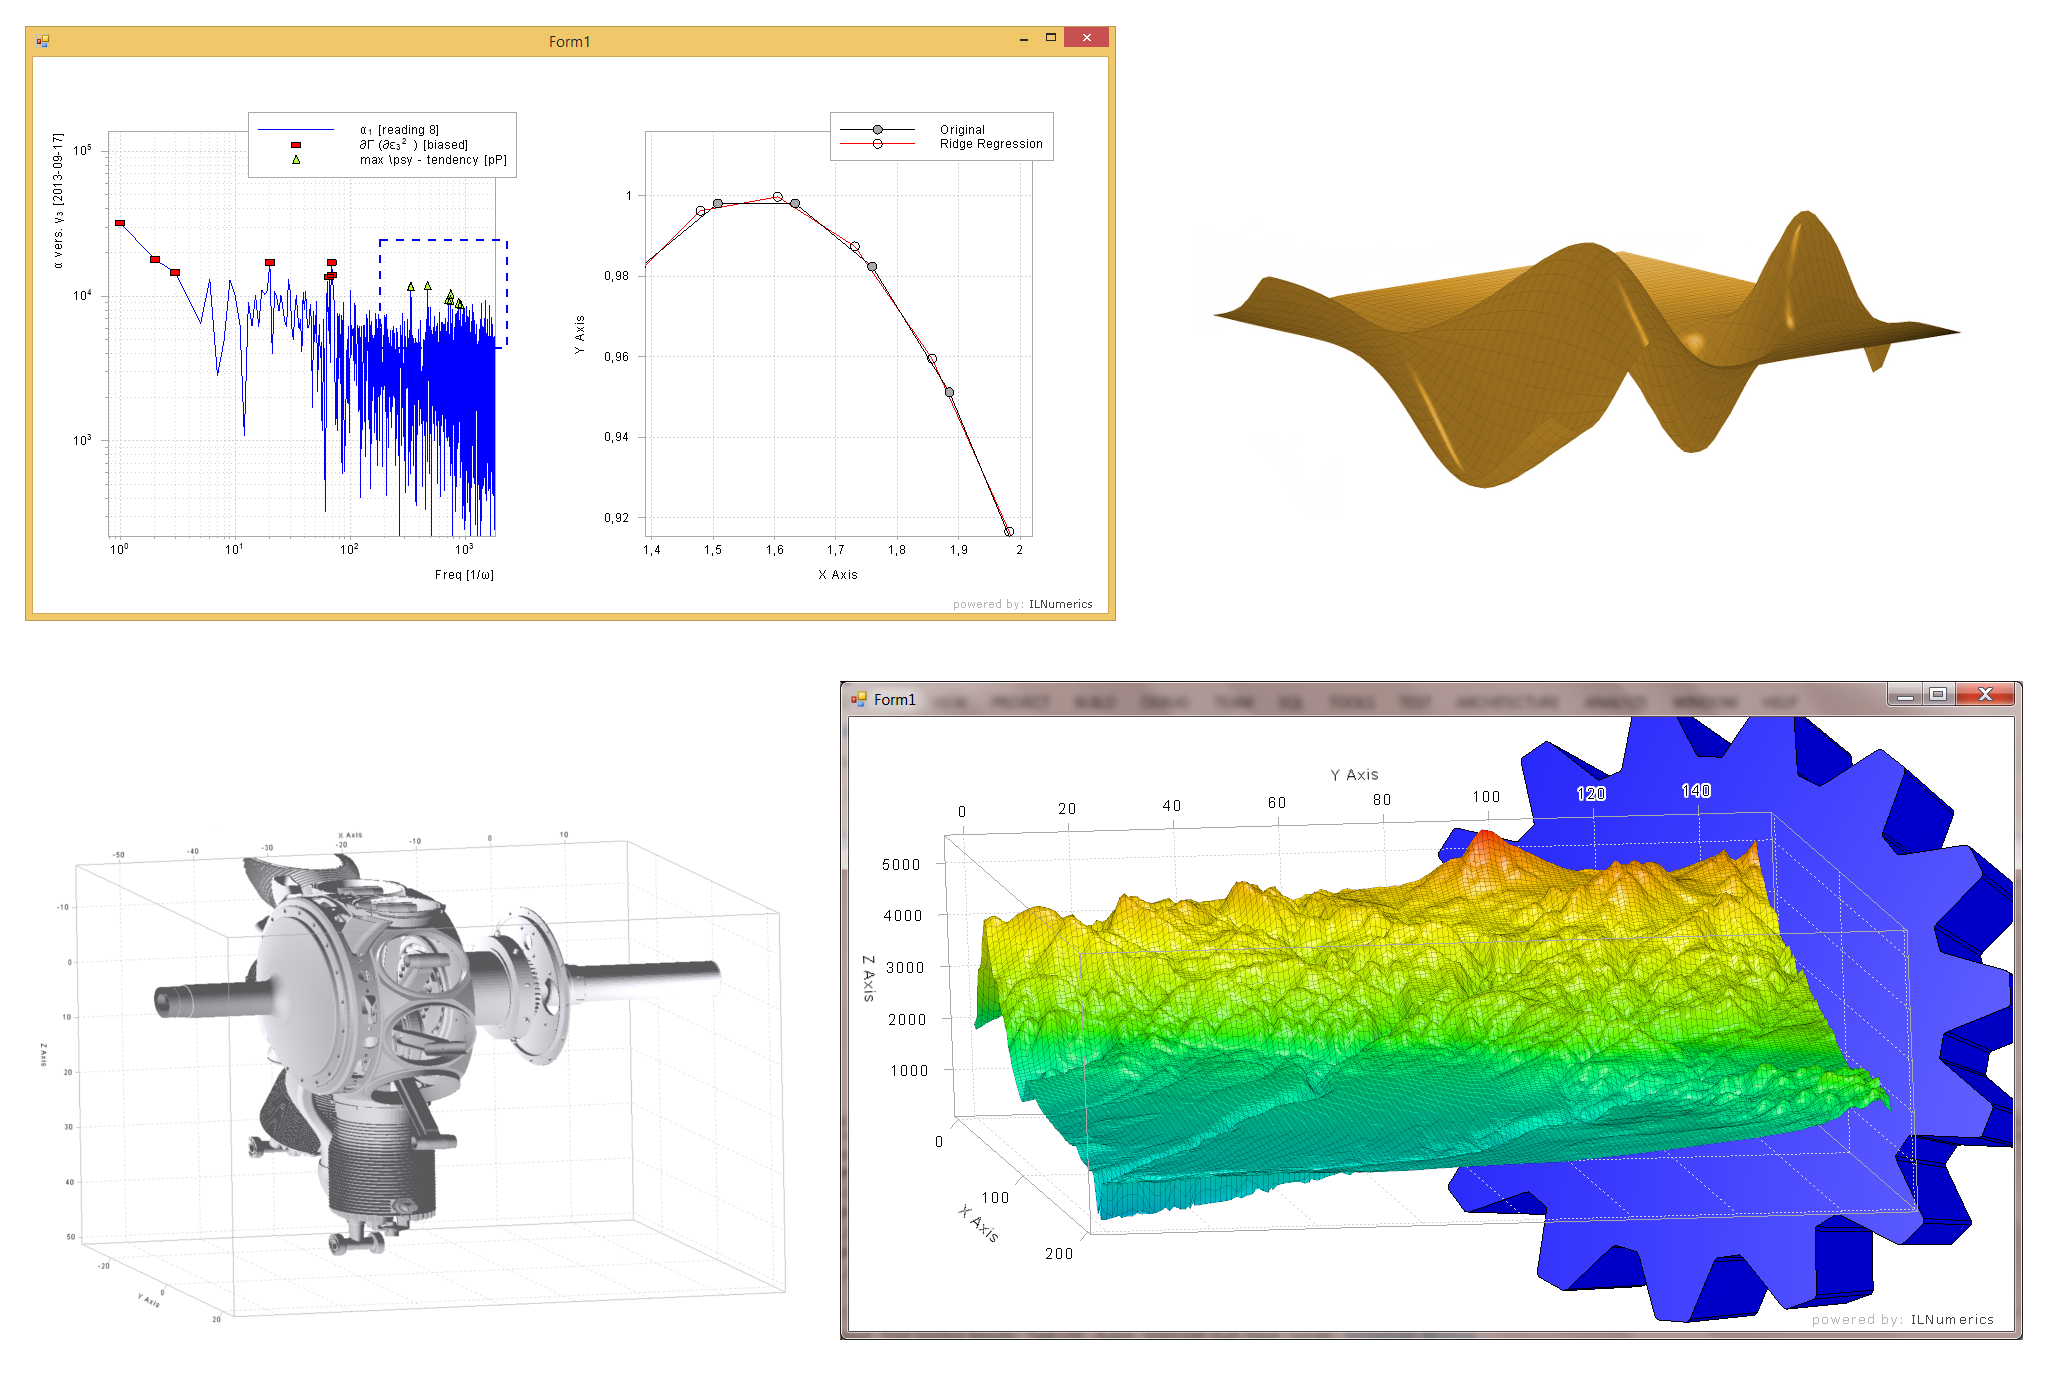
The high-level objects include plot cubes, scene objects and a number of different plots like line, surface, scatter, contour and bar plots. They allow you to quickly and easily generate standard plots and graphs while maintaining the flexibility you need for your application.
For highly customized plots and graphs the data Visualization Engine offers low-level objects like lines, points, labels, group nodes, triangles and many more. You can customize your graphs to arbitrary detail and still benefit from the simplicity and convenience of ILNumerics.
Simplicity - Intuitive Visualizations
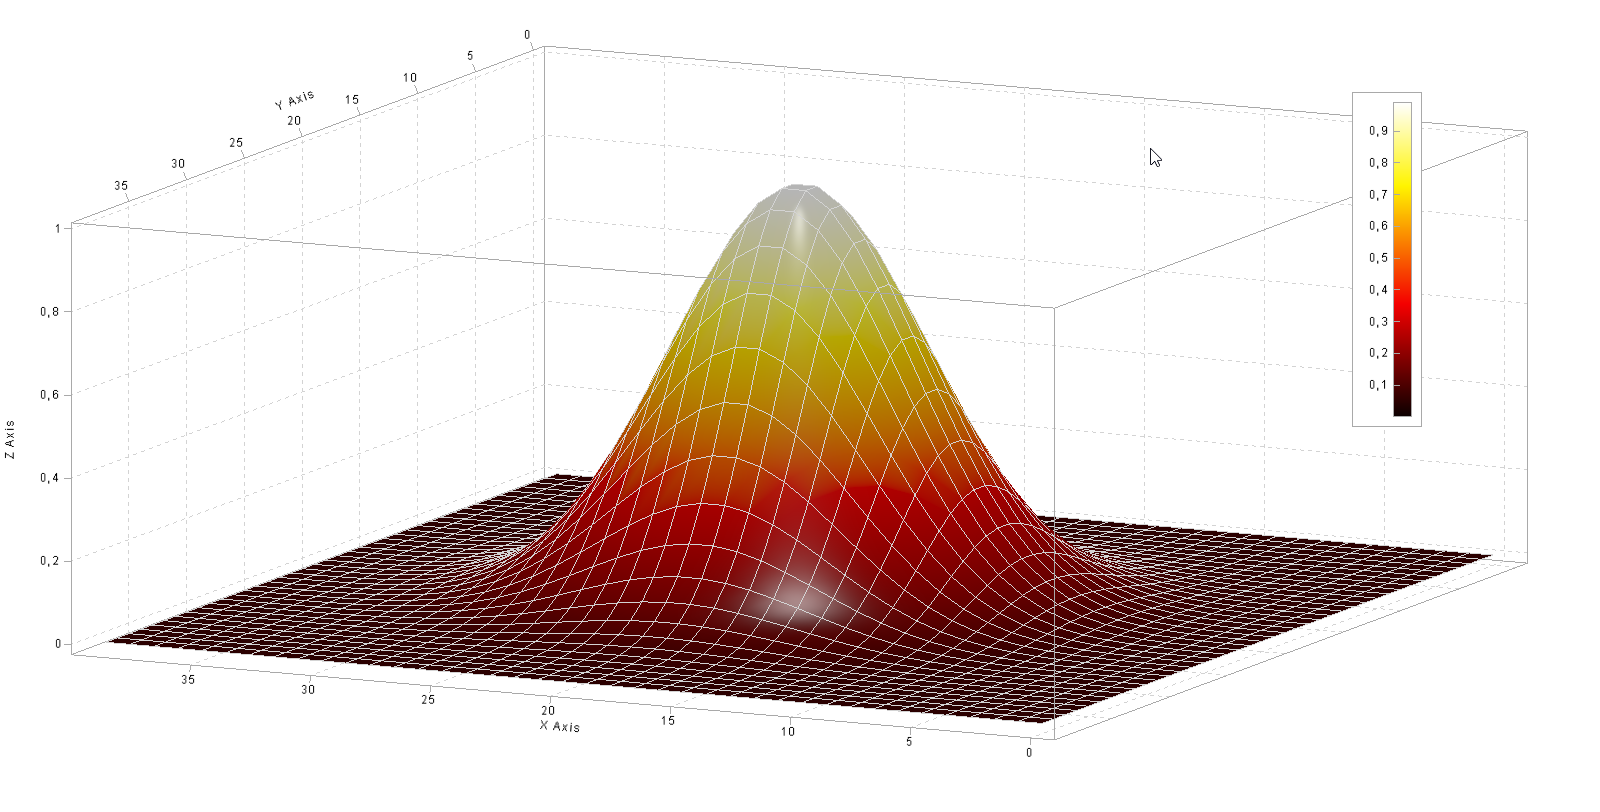
Getting Started with the ILNumerics Visualization Engine is as simple as instantiating a Panel control in your form. The scene is designed and controlled by the same convenient object oriented interface which makes programming GUIs in .NET so much easier than in other frameworks. The example scene above is created by code like this:
Our webcode components make it easy to learn ILNumerics: just change the code and press play to see the result.
Interactivity - Transform Visualizations into GUIs
All objects in the ILNumerics Visualization engine are designed from ground up for efficient dynamic capabilities. Other data visualizations stop at global rotation and zoom. We provide extended picking options and fine grained mouse event handling for any visible object - in 2D and 3D. This allows all kinds of intuitive interfaces: from interactive data labeling to fully featured 3D GUIs.
See what else is possible in our examples section and download your trial!