
Color Mapping
Color maps are used to highlight or provide additional information. In this tutorial we will show you how to use color maps in different graph types as well as create customized color maps.
This tutorial contains interactive web components, where you can code in C# and experiment with what you have learned. Here, you can find some more information on interactive web components.
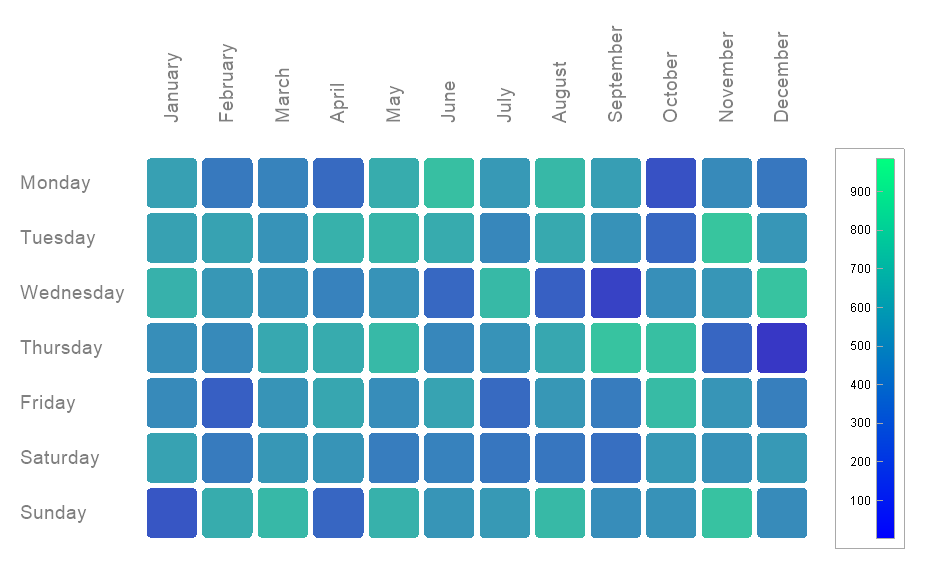
The graphs above display just two possible ways to use color maps in 2D. Let's take a look at the matrix chart on the left first. It shows the relationship between two variables: weekdays and months. The relationship to an additional variable is indicated by different color values.
To start with, we created an Colormap object by providing a built-in colormap. Since, we want to map the values of the array A, we have to compute its minimum and maximum values next. To map the values, we have to apply the method Map(), which is provided with the parameters A , min and max as shown in the example below.
The resulting (3 x n) array only contains values between 0 and 1. While the first line indicates the R level, the second and third line each represent the G and B level. The last line displays the alpha value for each color.
Next, we created an array of squares by using the built-in visualization class RoundedRectangle. In each iteration of the inner for loop, a new RoundedRectangle object is created. The resulting rectangle is then downscaled but also translated to an individual position. On top of setting its border to invisible, the colors that were calculated before are multiplied by 255 and then assigned.
In the interactive web component below you can see the complete code that also includes the creation of labels and a color bar. You can learn more about the configuration possibilities of labels here, but for now let's focus on the Colorbar object. An StaticColormapProvider object was created on the basis of the colormap we used before, the minimum and maximum values of the array A. It was then assigned to the property ColormapProvider. The class Colorbar exhibits many different properties that enable you to configure your color bar arbitrarily. Those properties are listed here.
Note that you can reposition the color bar by dragging it with your mouse in Visual Studio (not possible in the web component here).
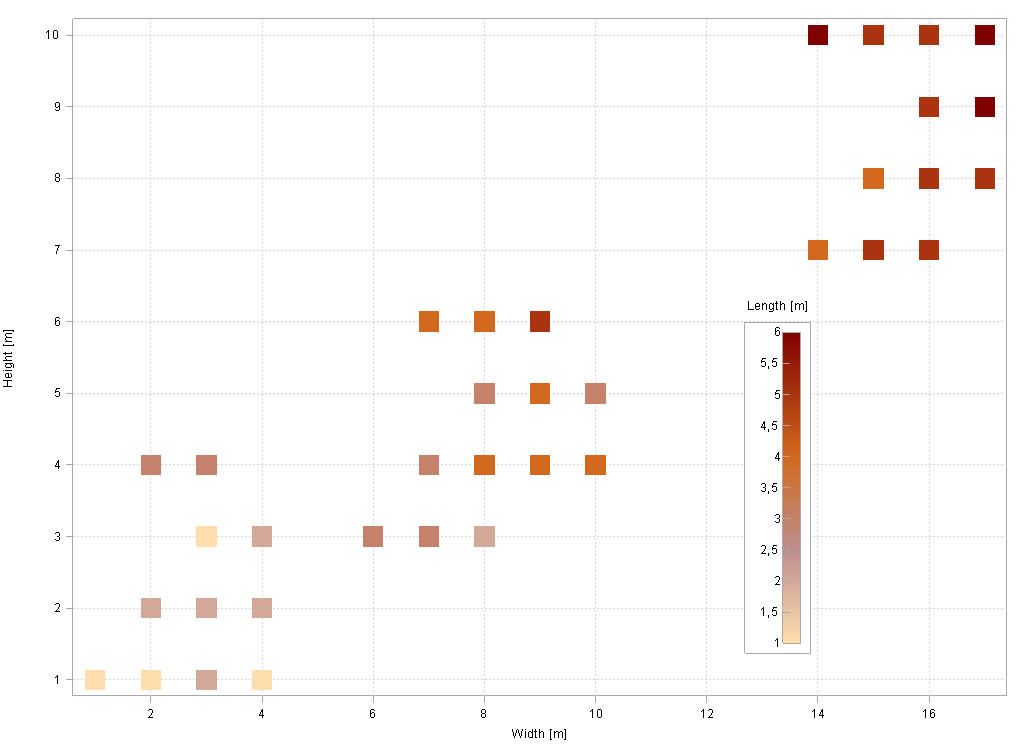
Now let's explore the second graph in more detail. The second graph also depicts the relationship between two variables: height and width. The relationship to the third variable length is indicated by different colors. In this example the focus is set on using custom color maps.
At first, we created an array GoldenColors that contains the key points of a custom color map. Then an Colormap object was created. At this point, it really does not matter which built-in colormap you choose, since we are going to override it anyways. In the next step the array GoldenColors was assigned to the Colormap property Data. Hereby, the structure of the array containing the key points of the custom color map is of importance. So let's take a closer look at what happens in the last line: The array GoldenColors must be divided by 255 to bring the color components into the requires [0...1] value range.
As a result, the first column now contains the positions of the key points, which are recommended to exhibit values between 0 and 1. The second column indicates the R level, while the third and fourth column each represent the G and B level. The last column depicts the alpha value of each color.
Next, we did just what we have done before: We computed the minimum and maximum values of the array we would like to map. The array's values are eventually mapped by calling the method Map().
Afterwards, we created only one Points object. It is then provided with a positions array. As a result, many points are generated. Finally, the array Colors is simply assigned to the property Colors of the Points object. A color are now automatically associated with a point. However, to enable this function, it is important to disable the single color option by setting the porperty Color to null. Otherwise the single color property value would take precedence and overwrite the individual colors.
The following interactive web component relates all the code snippets from above. Here again, we added a color bar. The only difference is that we added a label right above it. Since the label colorBarLabel is now a child of colorBar, it moves along with it and keeps its relative position when the color bar is dragged with the mouse in Visual Studio.