Colormapped Circles with PlotCube

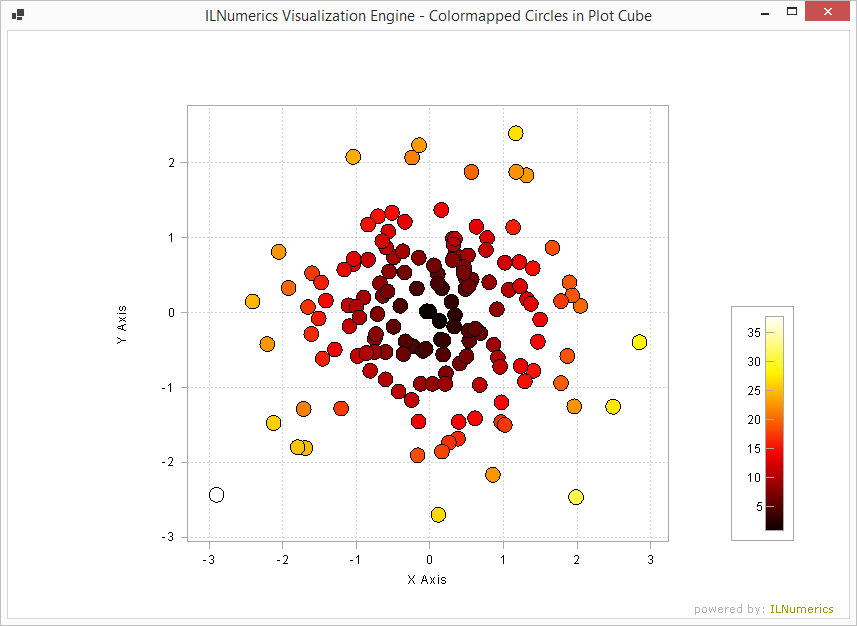
The example creates a number of circle objects, based on ILNumerics.Drawing.Circle. The circles are placed within a PlotCube instance and are displayed as plotting objects. Scaling and axis handling works just like for regular plot objects.
The fill color for the circles is determined by mapping a certain value associated to them to a color by help of a colormap. For this example, the distance of the circle to the center in the X/Y plane is used for selecting a color from the colormap.
A colorbar is created and displayed next to the plot cube. It shows the range of values and the colors assigned to them.
Note how the circles receive regular plotting features: the functionality of the plot cube is retained (rotation, panning etc.). Also, the circles are placed in 3D space, hence become assigned a z-position: their order is clearly visible when rotating the plot cube.
Last modified: August 26 2021 09:17

•using System;
•using System;
using System.Drawing;
using System.Windows.Forms;
using ILNumerics;
using ILNumerics.Drawing;
using ILNumerics.Drawing.Plotting;
namespace ColormappedCircles_inPlotCube {
public partial class Form1 : Form {
public Form1() {
InitializeComponent();
}
private void ilPanel1_Load(object sender, EventArgs e) {
// create random positions as circle midpoint locations
Array<float> A = ILMath.tosingle(ILMath.randn(3, 150)) * 10;
// the 4th dimension: here we take the distance from the middle of the distribution
Array<float> V = ILMath.sqrt(ILMath.sum(ILMath.pow(A["0,1;:"] - ILMath.mean(A["0,1;:"], 1), 2f), 0));
// create a colormap
var cm = new Colormap(Colormaps.Hot);
// configure min / max values (the full range for the colormap)
float min, max;
V.GetLimits(out min, out max);
// map values to colors
Array<float> colors = cm.Map(V, Tuple.Create(min, max)).T;
// add minimal setup: plotcube
var pc = ilPanel1.Scene.Add(new PlotCube(twoDMode: false));
// add individual circles, configure color based on colormap
var size = new Vector3(0.1, 0.1, 1);
for (int i = 0; i < A.S[1]; i++) {
var col = Color.FromArgb(255, (int)(255 * colors.GetValue(0, i)), (int)(255 * colors.GetValue(1, i)), (int)(255 * colors.GetValue(2, i)));
var gr = pc.Add(new Group() {
Children = {
new Circle(20) {
Fill = { Color = col }
}
}
});
gr.Translate(A.GetValue(0, i), A.GetValue(1, i), A.GetValue(2, i)); // circles are placed in 3D!
gr.Scale(size);
}
// add colorbar
pc.Add(new Colorbar() {
ColormapProvider = new StaticColormapProvider(cm, min, max)
});
// add title
Text = "ILNumerics Visualization Engine - Colormapped Circles in Plot Cube";
}
}
}