
Two XY line plots with markers and legend
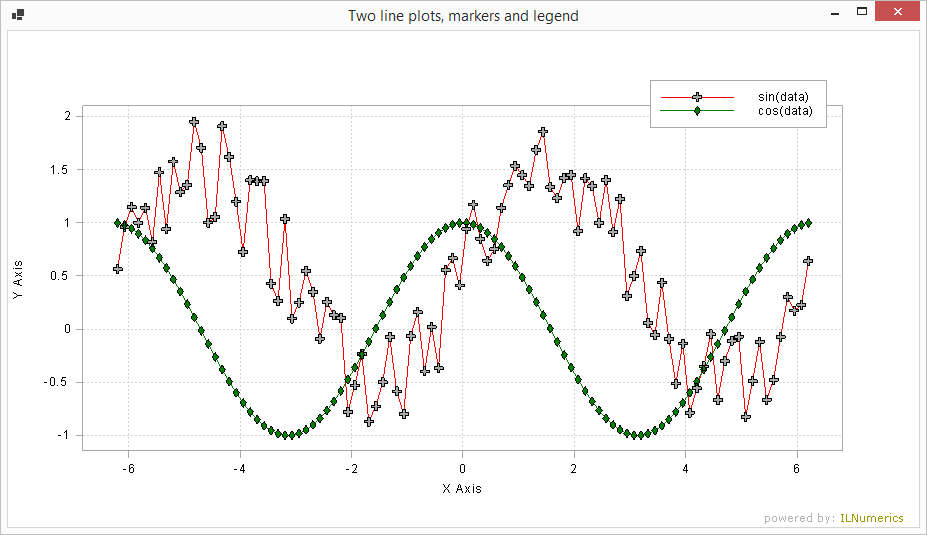
A simple and straight forward example creating two line plots, configured to display individual (different) markers each. The lines are annotated using a legend object. Legend items display a short segment of their corresponding line + the corresponding marker to help idenifying the line in the legend.
Last modified: August 25 2021 18:29