
Region Plot
RegionPlot is a class used to create the outlines of regions. It already comes with a database representing the world but also allows the user to provide their own database.
Using RegionPlot
Built-in database
To create an RegionPlot() object, you do not have to provide any additional information. As a result, the outline of the whole world will be visualized.
However, you may pick individual continents or ...
countries for visualization:
You can enter a cell that contains groups of countries and related labels. Hereby, the input parameter customGroups must be of a certain format displayed below.

Each group contains a label and an index array that lists indices referencing specific countries. The cell element that contains the label must be of the type string, while the index array must be of the type integer.
custom database
As mentioned above, it is also possible to provide your own database. That could be the case, if you wished to visualize different information or required a different resolution. For this purpose, you must provide a cell that contains the corresponding geometric data.
Hereby, it is essential that the cell is in a specific format. If your database happens to be a shapefile based on the shape type "polygon", you may use the class ShapefileReader() to convert it into a cell. The resulting cell already has the required format, therefore, it can directly be used for RegionPlot().
If you decide to write your own routine to convert your database, you have to make sure the resulting cell exhibits the correct format as displayed in the following image:
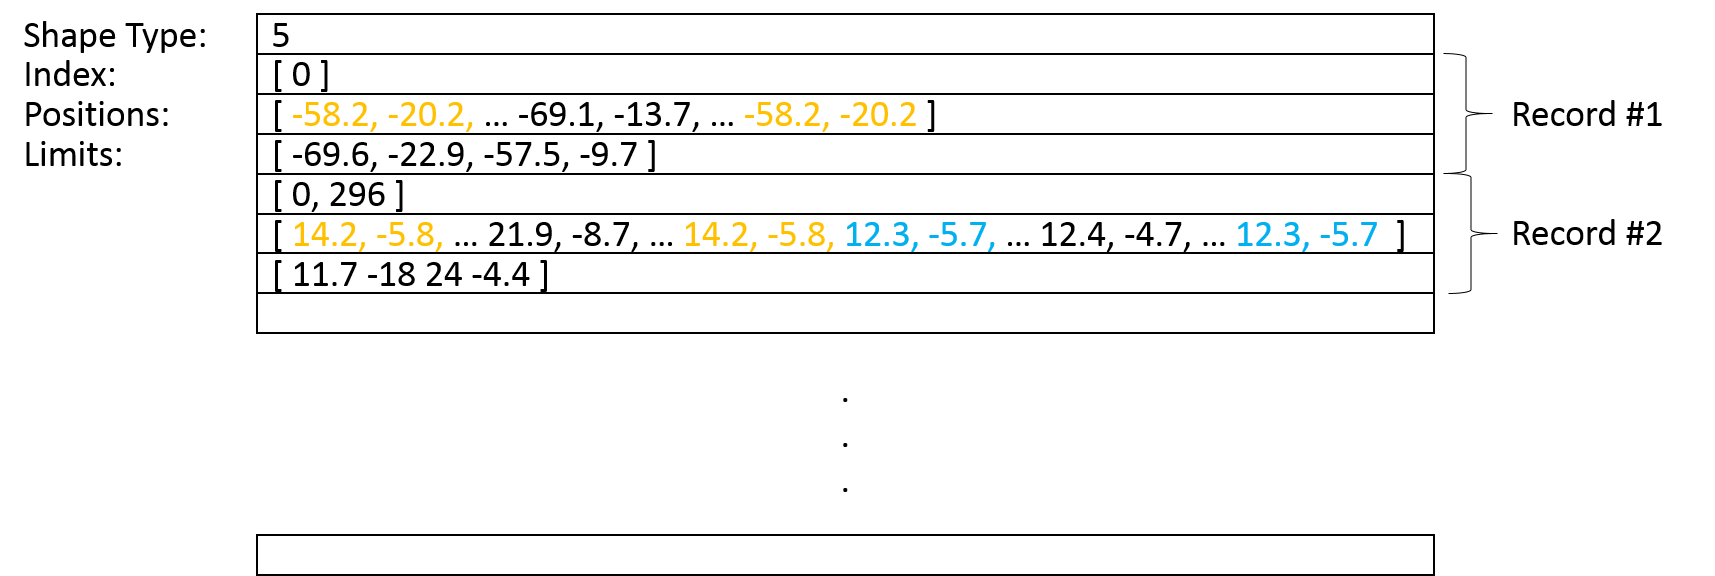
The first element of the cell must always contain the shapetype. RegionPlot() only visualizes geometric data based on closed polygons, which is reflected in the value of 5. The rest of the cell is split into so-called records. A record may describe a city, region or country. Each record must contain
- a positions array where the closed polygons are listed one after another
- an index array which consists of indices referencing the first point of each polygon and
- an array describing the limits of the record.
Special attention should be paid to the data type of each cell element. The shape type and the index arrays must aways be of the type integer, while the positions and limits arrays must be of the type double.
To only visualize certain records here, you may provide a vector that contains the corresponding indices. Use the input parameter customGroups to group and label regions just as explained above.
UPdate
Once an RegionPlot() object exists, you can use the Update() method to change the underlying database, select or group different regions.
Operating principle
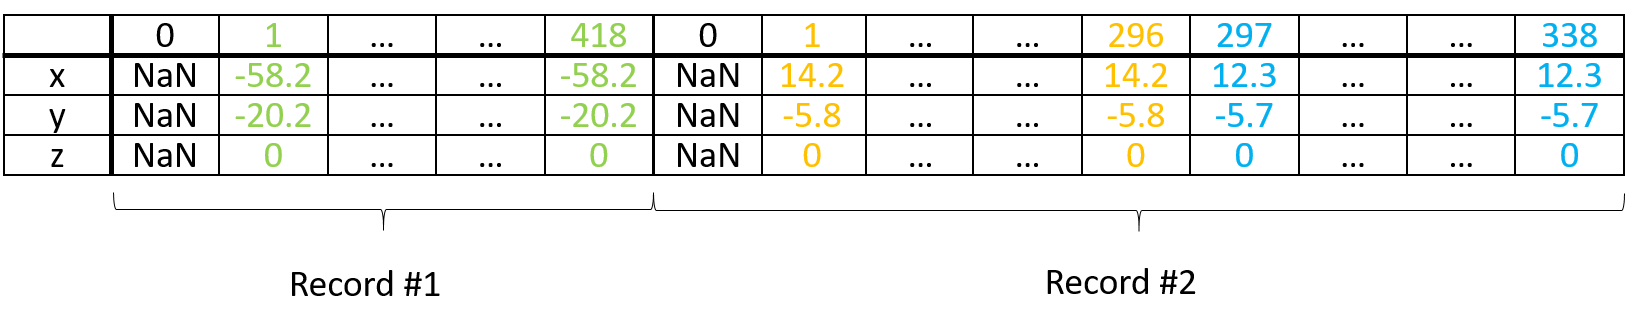
If all records or single records of a provided database are supposed to be visualized, an LineStrip() object is created for each. Therefore, it is possible to address each record seperately and change its properties. The corresponding indices and positions are written to the index and positions buffer of an LineStrip() object.
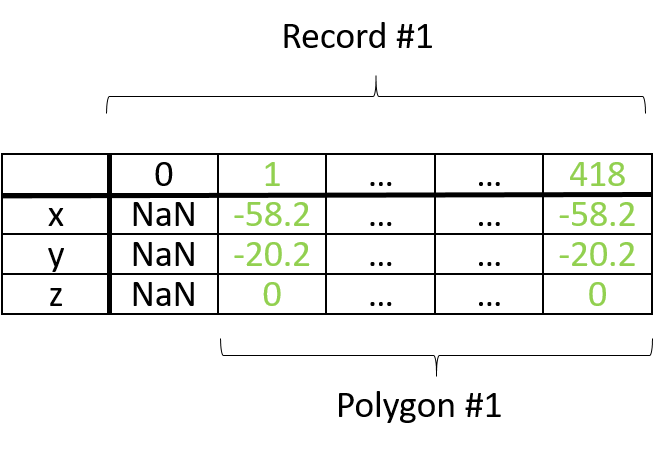
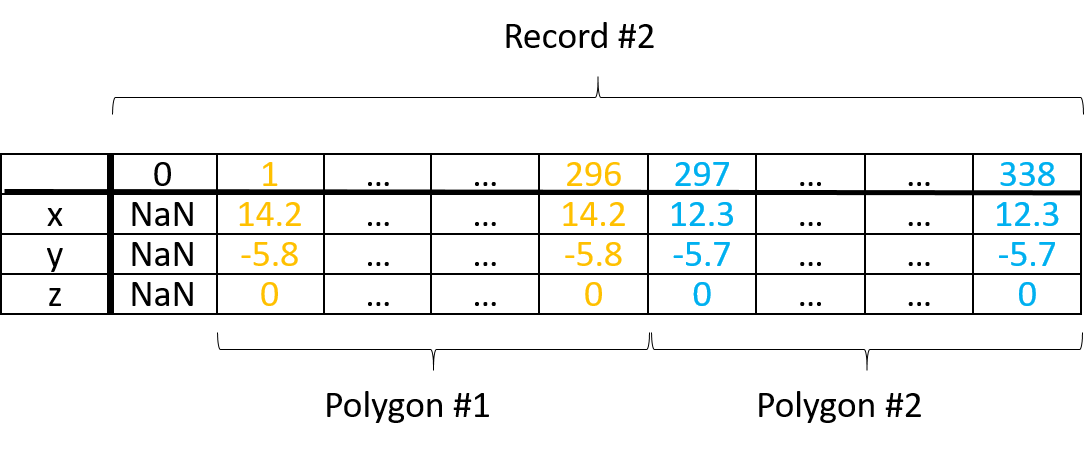
The images above display the positions buffers of two different LineStrip() objects. In contrast to the left buffer, the right one contains two polygons. Nevertheless, the first entry of both positions buffers is an array of NaN values.
To draw the polygons seperately, the array containing the NaN values of the positions buffer must always be referenced in between two polgyons:
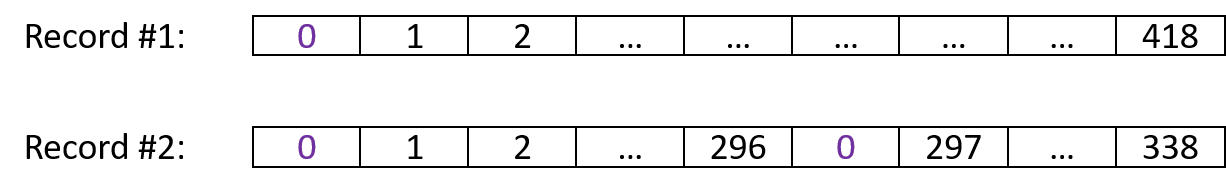
The first index buffer only references the first array of the corresponding positions buffer once, since there is only one polygon. In contrast, the second index buffer references the array containing the NaN values twice due to the two polygons.
If continents or custom groups are specified. Only one LineStrip() object per group is created. For this purpose, the corresponding positions and indices of all records contained in the specified group are written to one positions and index buffer:
As a result, only the group can be referenced and not the single records as shown in the plot below.
The advantage of using the input parameter customGroups is, that it is a lot easier to address this group by using the label.
OPtional parameters
According to your needs, you may further customize your plot by setting properties such as the width and color of the border.
further configuration
Since FillArea derives from Group, you have access to all configuration options of common group objects.
more information
For more detailed information and examples check out: