
3D Surface Plots in .NET (C# and Visual Basic)
3D Surface Plots in .NET (C# and Visual Basic) are used to visualize arbitrary rectangular grids of points in 3D space. Each element in the grid gets a point in 3D space assigned. In the simplest case, only the Z coordinates of the points are defined. X and Y coordinates are added automatically in order to create an equally spaced grid of connected points – forming a surface of the ‘heights’ of Z.
More complex surfaces allow the definition of individual colors for every grid point as well as individual X and Y coordinates. This allows for the creation of 4 dimensional (3d space + 1 color) arbitrary shaped surfaces. At the end of this section, examples for parametric surfaces are presented.
Surfaces are represented by the class ILNumerics.Drawing.Plotting.Surface. They are made out of:
- A fill area Surface.Fill, filling the area within 4 neighboring grid points,
- A wireframe Surface.Wireframe connecting direct neighbors with lines.
Fill and Wireframe are regular shapes (Triangles and Lines), hence are completely configurable: colors, visibility and line styles.
3D Surface Plots: Examples
The most simple method to setup a 3D surface is to provide Z values for the grid points only. Such values can be specified by a matrix of concrete values or as a height function. ILNumerics creates a regular grid and computes default values for the X and Y directions.
One example using an analytical function for the height values:
The ranges for the X and the Y axis are configurable, though. The next example creates a surface based on the same function and specifies a grid ranging from -2 to 10 for the X axis and from -1 to 3 for the Y axis. The number of grid rows/ columns are also configured. Furthermore, a CFunc is given in order to compute the color for each grid point based on its X,Y tuple:
In order to get full flexibility, one can provide the Z data and the X and Y coordinates for each grid point explicitely. The following example creates a simple surface from some precomputed data (here: sinc() function) and configures colors and wireframe individually. This time, the positions for the grid points are explicitely given as a single, precomputed 3-dimensional array:
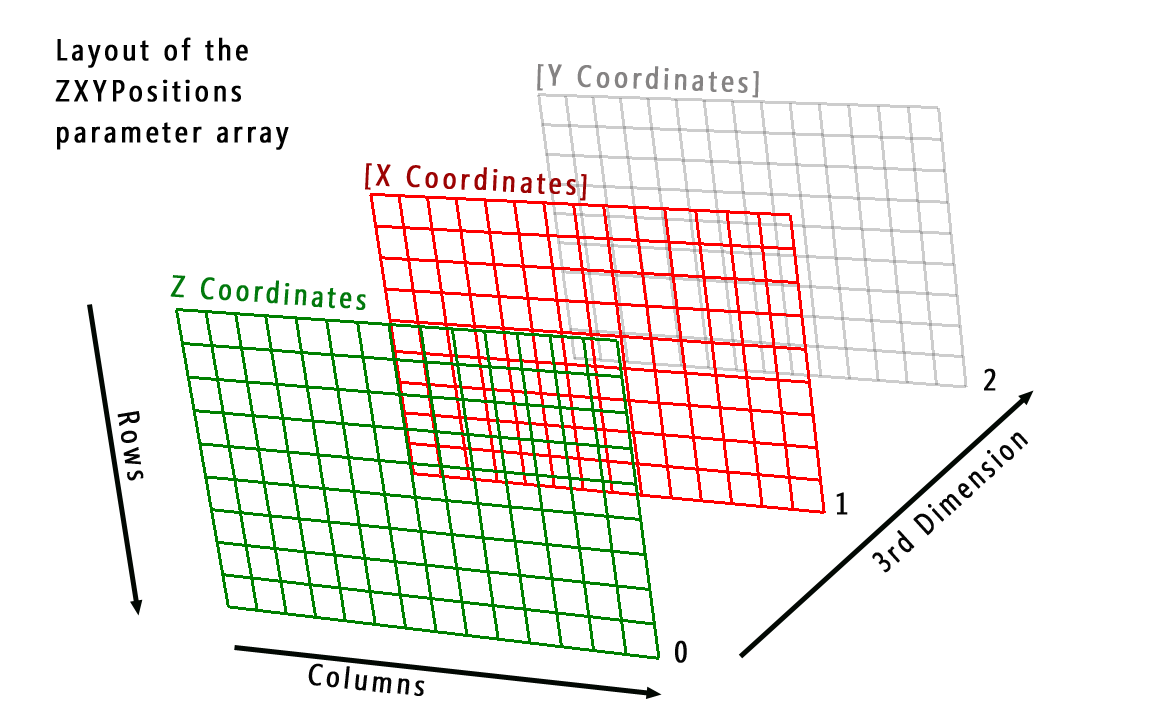
This constructor of Surface expects a ZXYPositions array with the coordinates for the grid points: coordinates of the grid points are to be layed out as matrices. Z coordinates are obligatory. Providing X and Y coordinates is optional. Note the coordinate ordering in the ZXYPositions parameter: Z is the first ‘slice’, X and Y are in the 2nd and 3rd index of the 3rd dimension in the array:
If one of X and/or Y coordinates are omitted, an evenly spaced grid is created for the missing coordinates, starting with 0 and grid point distances of 1.
- API documentation
- Surface Plots: Coloring
- Managing Colormaps
- Surface Lighting
- Dynamic Surfaces
- Parametric Surfaces
For plotting larger data consider ILFastSurface (apidoc). See its documentation here.