C# for 3D visualizations and Plotting in .NET

2D and 3D Visualizations are an important feature for a wide range of domains: both software developers and scientists often need convenient visualization facilities to create interactive scenes and to make data visible. The ILNumerics math library brings powerful visualization features to C# and .NET: ILView, the ILNumerics Scene Graph API and its plotting engine. We’d like to give an overview over our latest achievements.

ILView: a simple way to create interactive 3d visualizations

We have created ILView as an extension to our interactive web component: It allows you to simply try out ILNumerics’ 2d and 3d visualization features by chosing the output format .exe in our visualization examples. But that’s not all: ILView is also a general REPL for the evaluation of computational expressions using C# language. ILView is Open Source – find it on GitHub!
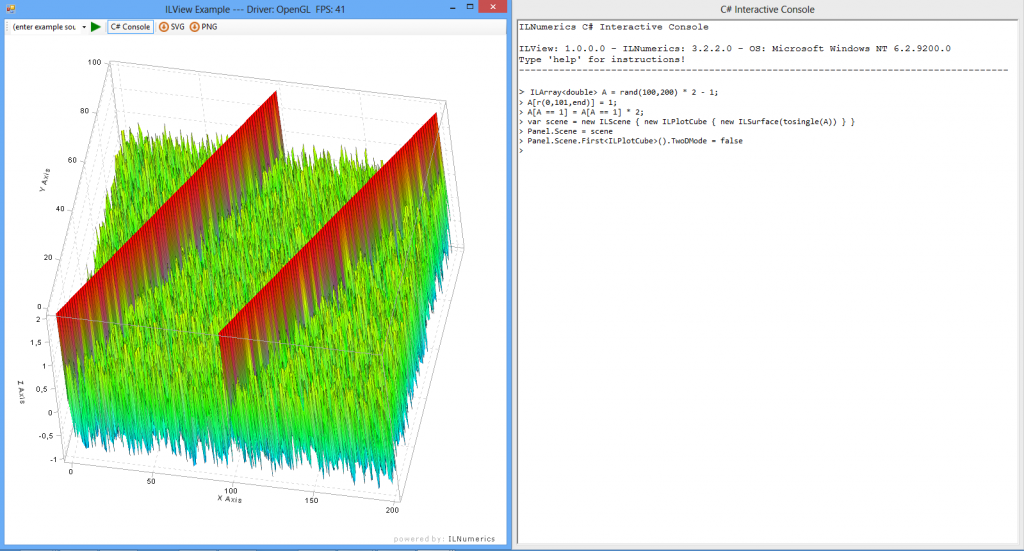
Screenshot of ILView
Using ILView for interactive 3D Visualization

ILNumerics Scene Graph: realize complex visualizations in .NET

The ILNumeric’s scene graph is the core of ILNumerics’ visualization engine. No matter if you want to create complex interactive 3D visualizations, or if you aim at enhancing and re-configuring existing scenes in .NET: The ILNumerics scene graph offers a convenient way to realize stunning graphics with C#. It uses OpenGL, GDI, and it’s possible to export scenes into vector and pixel graphics.
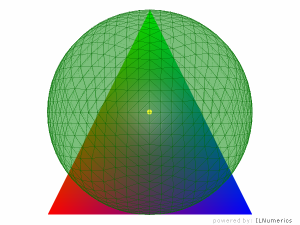
Screenshot of an interactive 3D scene
Using C# for 3D visualizations: the ILNumerics Scene Graph

Scientific Plotting: visualize your data using C#

With ILNumerics’ visualization capabilities, C# becomes the language of choice for scientists, engineers and developers who need to visualize data: Our plotting API and different kinds of plotting types (contour plots, surface plots etc.) make easy work of creating beautiful scientific visualizations.
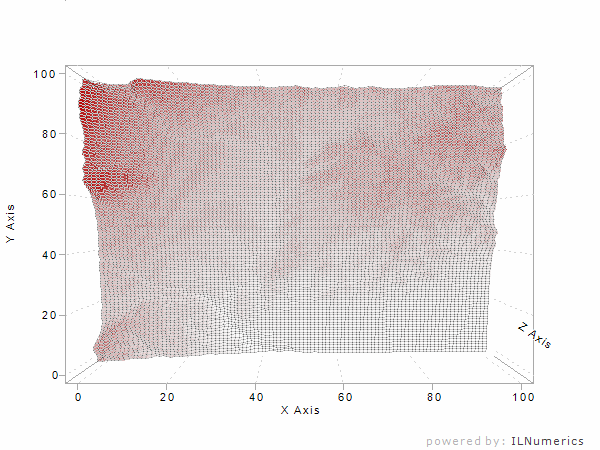
Screenshot of a Surface Plot in ILNumerics
Scientific Plotting in .NET: A Surface Plot created with ILNumerics
  • http://heliwave.com Ali Adams

    I need to build a 3D visualization application of the internal structure of the Quran’s Text as a graph network with nodes and links connecting words with same text, same root, or same value with full pan/tilt/zoom support.

    Any help is much appreciated.

    Quran’s Text Properties:
    – There are 29 unique letters (Alphabet).
    – There are 77878 words (14637 unique words).
    – Word length = 1 to 11 letters.
    – Longest repeated word range consists of 26 words in 4 consecutive verses (23:5-8 == 70:29-32).
    – Most repeated word range consists of 4 words in 31 verses in very close proximity within chapter 55.

    Graph Properties:
    – x-axis = chapter number. (1 to 114)
    – y-axis = verses per chapter. (3 to 286)
    – z-axis = words per verse. (1 to 128)

    Each NODE (x,y,z) represents a Word drawn as a 3D sphere with a diameter of 1 to 11 proportional to the number of its letters.
    Each LINK (x1,y1,z1 to x2,y2,z2) is 1 to 11 SUBLINKs proportional to the number of letters per Words it is connecting.
    Each SUBLINK has 1 of 29 colors representing a letter within the LINK’s Words.

    CONNECT LONGEST WORD RANGES FIRST, THEN NEAREST IF EQUAL LENGTH:
    – for each word range, get its length (number of words)
    and its nearest repeated word range (if any).
    – if a word range is a subset of a longer range,
    connect the longest repeated word ranges only,
    else connect to nearest word range.

    Ali Adams
    http://heliwave.com