In the third part of our series we focus on the visualization of scientific data. You learn how to easily display your data with ILNumerics and the ILPanels.
Continue reading ILNumerics for Science – How did you do the Visualization?
In the third part of our series we focus on the visualization of scientific data. You learn how to easily display your data with ILNumerics and the ILPanels.
Continue reading ILNumerics for Science – How did you do the Visualization?
Last time I started with one of the easiest problems in quantum mechanics: the particle in a box. This time I’ll add 1 dimension and we’ll see a particle in a 2D box. To visualize its wave function and density we need 3D surface plots.
This time we have a particle that is confined in a 2D box. The potential within the box is zero and outside the box infinity. Again the solution is well-known and can be found on Wikipedia. This time the state of the wave function is determined by two numbers. These are typically called quantum numbers and refer to the X and the Y direction, respectively.
The absolute size of the box doesn’t really matter and we didn’t worry about it in the 1D case. However, the relative size of the length and the width make a difference. The solution to our problem reads
$\Psi_{n,k}(x,y) = \sqrt{\frac{4}{L_x L_y}} \cdot \sin(n \cdot \pi \cdot x / L_x) \cdot \sin(k \cdot \pi \cdot y / L_y)$
Very similar to the 1D case I quickly coded the wave function and the density for further plotting. I had to make sure that the arrays are fit for 3D plotting, so the code looks a little bit different compared to last post’s
     public static ILArray<double> CalcWF(int EVXID, int EVYID, double LX, double LY, int MeshSize)
     {
        ILArray<double> X = linspace<double>(0, LX, MeshSize);
        ILArray<double> Y = linspace<double>(0, LY, MeshSize);

        ILArray<double> Y2d = 1;
        ILArray<double> X2d = meshgrid(X, Y, Y2d);

        ILArray<double> Z = sqrt(4.0 / LX / LY) * sin(EVXID * pi * X2d / LX) * sin(EVYID * pi * Y2d / LY);

        return Z.Concat(X2d,2).Concat(Y2d,2);
     }
Again, this took me like 10 minutes and I was done.
This time the user can choose the quantum numbers for X and Y direction, the ratio between the length and the width of the box and also the number of mesh points along each axis for plotting. This makes the visualization panel a little bit more involved. Nevertheless, it’s still rather simple and easy to use. This time it took me only 45 minutes – I guess I learned a lot from last time.
Here is the result of my little program. You can click and play with it. If you’re interested, you can download the Particle2DBox source code. Have fun!
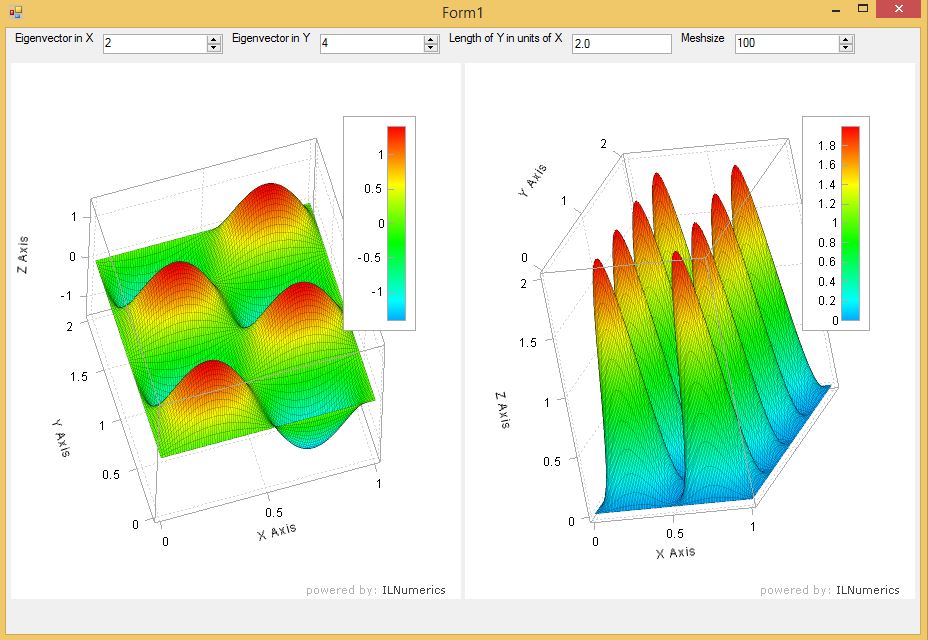 This is a screenshot of the application. I chose the second quantum number along the x axis and the fourth quantum number along the y axis. The box is twice as long in y direction as it is in x direction. The mesh size is 100 in each direction. On the left hand side you see the wave function and on the right hand side the probability density.
It seems that we’re facing a trend at the moment: scientific computing, math and visualization software for web browsers. With our interactive web examples we have taken a step into that direction, too: Visitors of our website can change the C# code of our plotting and visualization demos in order to create a new SVG, PNG, JPG or EXE output. This allows people to easily try out the ILNumerics syntax and our powerful 2d and 3d visualization features for .NET. In addition to that, ILView allows a convenient way to interactively explore scenes that are created with ILNumerics.
There are two other web applications that cause a lot of excitement in the scientific community at the moment: The IPython Notebook and Shiny, a tool for creating web applications in R. Let’s have a closer look…
The IPython Notebook adresses the huge amount of Python users in the scientific community. It basically offers a new way for writing papers: It’s a web based editor for code execution, math, text and visualization. Because the IPython Notebook combines all parts you normally need to write a scientific paper, you won’t have to import / export different elements from several domain specific software applications: “Everything related to my analysis is located in one unified place”, explains Philip J. Guo in his blog (http://www.pgbovine.net/ipython-notebook-first-impressions.htm). Once you have finished your paper, you can share your IPython Notebook as HTML and PDF with your colleagues, your professor etc.
Shiny stands for a different approach: It allows you to implement own analysis into web applications. While IPython obviously adresses Python users, Shiny is based on R, a still very popular programming language among statisticians. What makes Shiny interesting are its interactivity features: Most demos on the Shiny website offer the opportunity to choose input parameters from text fields or drop-downs to dynamically change the output visualization. The code seems to be quite similar to R, so users who are familiar with that language will easily be able to create interactive data visualization applications for their websites using Shiny.
Both approaches make web browsers accesable for specific needs of scientific visualization: The IPython Notebook offers a convenient tool to share the results of analytics related research; Shiny allows R developers to publish particular interactive plots on the web.
However, both projects are limited – namely because of technological issues. The level of performance that can be realized with both platforms is restricted: You’ll face that at the latest when you start creating complex 3d scenes with either Python or R. This holds true for the platforms’ web applications, too…
For certain purposes web based scientific computing software offers new convenient solutions. But if you want to realize complex interactive 3d visualizations, you still won’t use any of them but an application on your local machine instead.
Our interactive web examples point the direction we want to go. In order to make scientific computing more powerful, we’re working on the next step of our approach: a full WebGL support for ILNumerics. Stay tuned…