Category Archives: Visualization

Release Notes ILNumerics 4.13 (detailed)

See this changelog for a quick list of all changes in version 4.13. Here we dive into some details about specific topics.

Visualization Engine Improvements

The main goal of the GDI renderer is still to provide a fully compatible alternative to the OpenGL renderer. It automatically replaces the OpenGL default renderer if a problem / incompatible hardware etc. was detected at runtime. The focus lays on feature completeness and precision of the rendering result. The quality of the GDI renderer has been further improved to these regards in 4.13. Changes affect the following low level rendering features.

Antialiasing

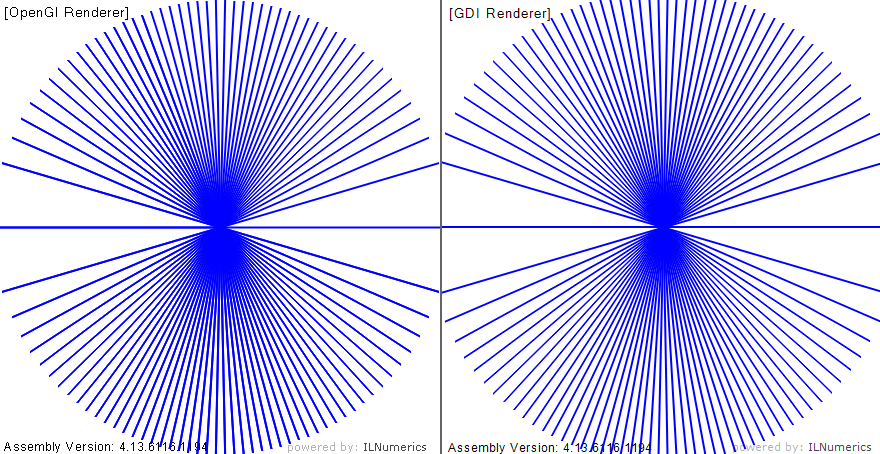
Lines now recognize the ILLines.Antialiasing property for thick lines (Width > 2). The antialised rendering works in all situations: transparent lines, lines with stipple patterns, inside /outside of plot cubes and for logartithmic / linear axis scales. The quality of the antialiasing implementation is now on par with common OpenGL implementations.

The new default value for ILLines.Antialiasing is now true. However, thin lines would not profit from antialiasing, hence thin lines will continue to ignore the value of the ILLines.Antialiasing property.

Note, that some OpenGL drivers actually refuse to render certain combinations of line properties. We experienced such behavior for stippled, thick line strips having antialiased rendering configured. In such situations you should make sure to have the most recent OpenGL / graphics card drivers installed. Alternatively you may chose either stippled pattern – / or antialiased rendering by explicitly configuring your lines for either one setting. Or use the GDI renderer instead.

Following is a screenshot of some lines examples. The left side shows the OpenGL renderer result. On the right side the GDI version is shown. Use your browser to show the full, unscaled image (right click on the image):

LinesAntialiasingGDIversOpenGL413… and with dotted lines:DottedLinesAntialiasingGDIversOpenGL413


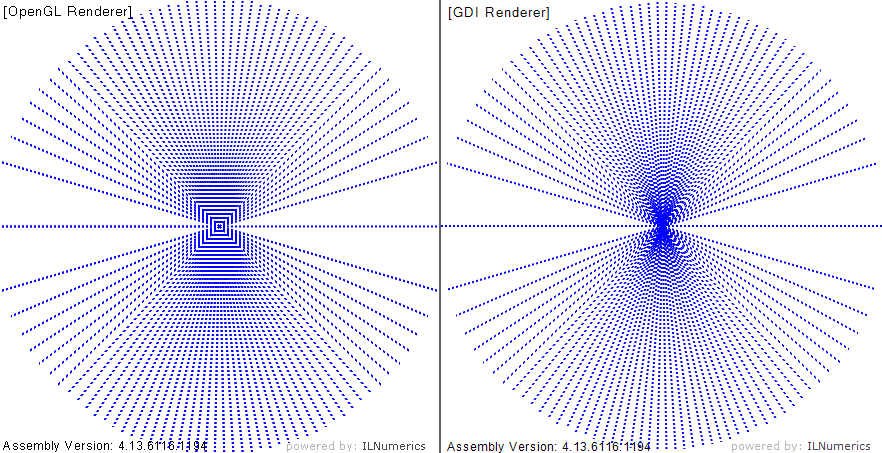
Default Color for ILLines & ILLineStrip

Basic, low level line shapes are now created with a default color: black. Higher level objects (as ILLinePlot, ILSplinePlot, Markers, ILSurface etc.) should always provide a color for low-level objects or use vertex based coloring explicitly. If you are assembling your scene with the low level line objects make sure to check that you have done this. This is not a breaking change.

Note that the setting for the shapes Color property overrides the vertex colors buffer (Colors property). In order to use vertex based coloring one must set the Color property to null, enabling the colors information from the Colors buffer.

Auto Color for Spline Plots

ILSplinePlot (derived from ILLinePlot) now adopts the auto-coloring feature from the ILLinePlot class. When no line color was given at the time the plot was created the color gets assigned which comes next in the ILLinePlot.NextColor color enumeration. Use the linecolor constructor argument of ILSplinePlot or the Line.Color property in order to control the color of the spline line explicitly.

Camera Default Depth: 100

In earlier versions the default ILCamera.ZFar value was 1000 which led to depth buffer precision issues in some situations. The new default value of 100 increases the depth buffer precision significantly. However, the new value (just like the old one) does not take into account the actual depth of your scene! If you encounter unwanted clipping in the far clippping area now, set the value for scene.Camera.ZFar explicitly. At best you know the depth of your scene and use this value. Or – more simple – use the old default of 1000:

 scene.Camera.ZFar = 1000; 

Visual Studio 2017 Compatibility

With the new version ILNumerics installs into the great, fresh new Visual Studio 2017 (released March 2017). … well, at least ‘kind of’…  What is true is that with 4.13 you can again use ILNumerics in all recent Visual Studio editions supporting extensions at all (which is all editions except Express Edition – I wonder if anyone is using this, still??), including Visual Studio 2017 Community Edition. This is great and all … but:

As you noticed there was a great deal of changes coming with VS2017. This includes the installer system which is – great attempt! – much more slim now by omitting unneeded stuff from the installation. But VS2017 also requires changes to the manifest files facilitating every Visual Studio Extensibility project. A new version has been introduced: version3. This is the first version which is not compatible with Visual Studio 2010 anymore. As a consequence, by supporting the new extension packaging system we would be required to drop support for Visual Studio 2010. This is not too dramatic since the 6 years VS2010 is out now feel kind of an eternity in our dev-world. However, we wanted to give the remaining VS2010 customers at least one version iteration of deprecating VS2010 in order to jump to a more recent version smoothly.

Additionally, the way the new VS installer works seems to reflect not the last word spoken on that topic (at least this is what we hope). The bottom line: we use an MSI installer, wrapped in an exe bootstrapper. The MSI installs all GAC binaries, registers the development dlls in Visual Studio, maintains the singleton installation directory and triggers the VSIX installer which installs the extension into all supported Visual Studio installations located on the system. This may sound complicated but worked quite reliably over the years.

Now, with the new Visual Studio package system things become odd. Out of subtle reasons, the MSI cannot (reliably) trigger the VSIX package automatically (and quietly). The reason becomes obvious when considering that the new extension potentially needs to trigger the installation of new components which it depends on. This install would not be possible while the hosting MSI is being installed itself still. So, as a consequence, currently, MSI installs of VSIX extensions into VS2017 are simply not working. When you start the ILNumerics installation from the delivered *.exe you will find the extension being installed into VS2010 and upwards – with the exception of Visual Studio 2017 :(

Currently, some smart (WIX) people are attempting a solution to this. But we are not aware of a clean solution released already. Therefore, we will wait for it and/or eventually consider a new deployment scheme for our extensions.

However, luckily there is a simple workaround for now! After the ILNumerics installation was finished, you can easily install our extension into VS2017 manually. Just go to the installation folder (by default: C:\Program Files (x86)\ILNumerics\ILNumerics Ultimate VS\bin) and find the ‘ILNumerics.VSExtension.vsix’ file. Double click on it to start the installation into the remaining Visual Studio instances manually. This should work without problems. Be sure to accept the warning dialog during the install. It originates from the fact that our extension must still support older Visual Studio extension techniques.

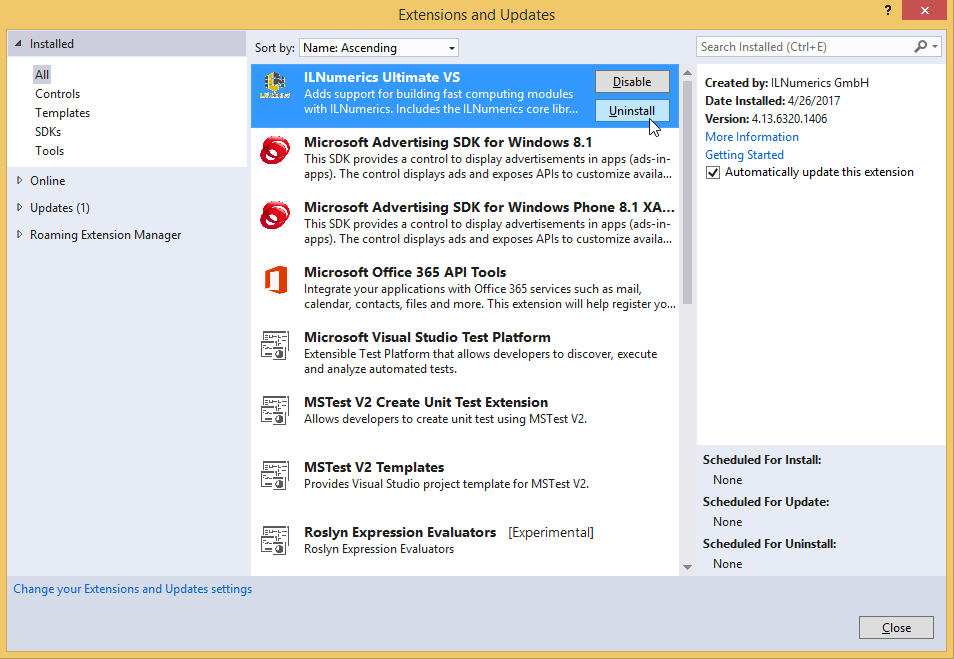
Keep in mind that this is a workaround, though! Once installed the extension will work as expected. But some things will not work consistentyl. Deinstallation, for example must be done manually from the “Extensions and Tools” dialog within Visual Studio 2017:

A manually installed extension requires a manual uninstall.

Also, in difference to the machine wide installation done by the (administrative) MSI install the manual VSIX installation changes the local user account only. You may have to repeat the VSIX install for other user accounts. Besides these lowered installation experience we know of no other incompatibilities in Visual Studio 2017.

ILNumerics for Scientists – Going 3D

Recap

Last time I started with one of the easiest problems in quantum mechanics: the particle in a box. This time I’ll add 1 dimension and we’ll see a particle in a 2D box. To visualize its wave function and density we need 3D surface plots.

2D Box

This time we have a particle that is confined in a 2D box. The potential within the box is zero and outside the box infinity. Again the solution is well-known and can be found on Wikipedia. This time the state of the wave function is determined by two numbers. These are typically called quantum numbers and refer to the X and the Y direction, respectively.

The absolute size of the box doesn’t really matter and we didn’t worry about it in the 1D case. However, the relative size of the length and the width make a difference. The solution to our problem reads

$\Psi_{n,k}(x,y) = \sqrt{\frac{4}{L_x L_y}} \cdot \sin(n \cdot \pi \cdot x / L_x) \cdot \sin(k \cdot \pi \cdot y / L_y)$

The Math

Very similar to the 1D case I quickly coded the wave function and the density for further plotting. I had to make sure that the arrays are fit for 3D plotting, so the code looks a little bit different compared to last post’s

     public static ILArray<double> CalcWF(int EVXID, int EVYID, double LX, double LY, int MeshSize)
     {
        ILArray<double> X = linspace<double>(0, LX, MeshSize);
        ILArray<double> Y = linspace<double>(0, LY, MeshSize);

        ILArray<double> Y2d = 1;
        ILArray<double> X2d = meshgrid(X, Y, Y2d);

        ILArray<double> Z = sqrt(4.0 / LX / LY) * sin(EVXID * pi * X2d / LX) * sin(EVYID * pi * Y2d / LY);

        return Z.Concat(X2d,2).Concat(Y2d,2);
     }

Again, this took me like 10 minutes and I was done.

The Visualization

This time the user can choose the quantum numbers for X and Y direction, the ratio between the length and the width of the box and also the number of mesh points along each axis for plotting. This makes the visualization panel a little bit more involved. Nevertheless, it’s still rather simple and easy to use. This time it took me only 45 minutes – I guess I learned a lot from last time.

The result

Here is the result of my little program. You can click and play with it. If you’re interested, you can download the Particle2DBox source code. Have fun!

Particle2DBoxThis is a screenshot of the application. I chose the second quantum number along the x axis and the fourth quantum number along the y axis. The box is twice as long in y direction as it is in x direction. The mesh size is 100 in each direction. On the left hand side you see the wave function and on the right hand side the probability density.

Getting to know your Scene Graph

Did you ever miss a certain feature in your ILNumerics scene graph? You probably did. But did you know, that most of the missing “features” mean nothing more than a missing “property”? Often enough, there is only a convenient access to a certain scene graph object needed in order to finalize a required configuration.

Recently, a user asked how to turn the background of a legend object in ILNumerics plots transparent. There doesn’t seem to be a straight forward way to that. One might expect code like the following to work:

var legend = new ILLegend("Line 1", "Line 2");
legend.Background.Color = Color.FromArgb(200, Color.White);

Continue reading Getting to know your Scene Graph

Fun with HDF5, ILNumerics and Excel

It is amazing how many complex business processes in major industries today are supported by a tool that shines by its simplicity: Microsoft Excel. ‘Recently’ (with Visual Studio 2010) Microsoft managed to polish the development tools for all Office applications significantly. The whole Office product line is now ready to serve as a convenient, flexible base framework for stunning custom business logic, custom computations and visualizations – with just a little help of tools like ILNumerics.

ExcelWorkbook1In this blog post I am going to show how easy it is to extend the common functionality of Excel. We will enable an Excel Workbook to load arbitrary HDF5 data files, inspect the content of such files and show the data as interactive 2D or 3D plots. Continue reading Fun with HDF5, ILNumerics and Excel

Plotting Fun with ILNumerics and IronPython

Since the early days of IronPython, I keep shifting one bullet point down on my ToDo list:

* Evaluate options to use ILNumerics from IronPython

Several years ago there has been some attempts from ILNumerics users who successfully utilized ILNumerics from within IronPython. But despite our fascination for these attempts, we were not able to catch up and deeply evaluate all options for joining both projects. Years went by and Microsoft has dropped support for IronPython in the meantime. Nevertheless, a considerably large community seems to be active on IronPython. Finally, today is the day I am going to give this a first quick shot.

Continue reading Plotting Fun with ILNumerics and IronPython

Dark color schemes with ILPanel

I recently got a request for help in building an application, where ILPanel was supposed to create some plots with a dark background area. Dark color schemes are very popular in some industrial domains and ILNumerics’ ILPanel gives the full flexibility for supporting dark colors. Here comes a simple example:

Continue reading Dark color schemes with ILPanel

C# for 3D visualizations and Plotting in .NET

2D and 3D Visualizations are an important feature for a wide range of domains: both software developers and scientists often need convenient visualization facilities to create interactive scenes and to make data visible. The ILNumerics math library brings powerful visualization features to C# and .NET: ILView, the ILNumerics Scene Graph API and its plotting engine. We’d like to give an overview over our latest achievements.

ILView: a simple way to create interactive 3d visualizations

We have created ILView as an extension to our interactive web component: It allows you to simply try out ILNumerics’ 2d and 3d visualization features by chosing the output format .exe in our visualization examples. But that’s not all: ILView is also a general REPL for the evaluation of computational expressions using C# language. ILView is Open Source – find it on GitHub!

Screenshot of ILView
Using ILView for interactive 3D Visualization

ILNumerics Scene Graph: realize complex visualizations in .NET

The ILNumeric’s scene graph is the core of ILNumerics’ visualization engine. No matter if you want to create complex interactive 3D visualizations, or if you aim at enhancing and re-configuring existing scenes in .NET: The ILNumerics scene graph offers a convenient way to realize stunning graphics with C#. It uses OpenGL, GDI, and it’s possible to export scenes into vector and pixel graphics.

Screenshot of an interactive 3D scene
Using C# for 3D visualizations: the ILNumerics Scene Graph

Scientific Plotting: visualize your data using C#

With ILNumerics’ visualization capabilities, C# becomes the language of choice for scientists, engineers and developers who need to visualize data: Our plotting API and different kinds of plotting types (contour plots, surface plots etc.) make easy work of creating beautiful scientific visualizations.

Screenshot of a Surface Plot in ILNumerics
Scientific Plotting in .NET: A Surface Plot created with ILNumerics