
Visualization Engine for .NET
The ILNumerics Visualization Engine adds interactive 2D and 3D graphics to technical .NET applications. It is designed for scientific plotting, engineering dashboards, simulation tools, data inspection, and production software built with C#, Visual Basic, WPF, and Windows Forms.
 Instead of treating visualization as a separate charting layer, ILNumerics connects rendering directly to numerical data, application logic, and the ILNumerics Computing Engine. Developers can create dynamic scenes, update data at runtime, combine multiple plot types, and keep visualization code readable and maintainable.
Interactive technical visualization for production .NET applications.
What you can build
- 2D plots, line plots, scatter plots, contour plots, and image plots
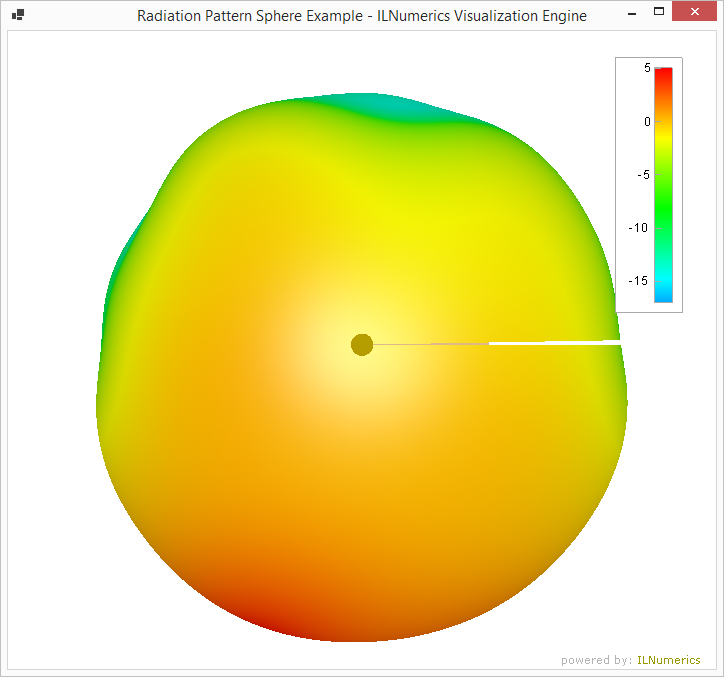
- 3D surfaces, meshes, volumes, and custom 3D scenes
- Engineering dashboards and interactive analysis tools
- Simulation, measurement, and industrial monitoring interfaces
- Reusable visualization components for larger .NET applications
Key features
Interactive 2D and 3D rendering
ILNumerics provides hardware-accelerated rendering for complex and dynamic scenes. Visualization controls are available for WPF and Windows Forms, with automatic selection between OpenGL and software rendering where appropriate.
Scene graph architecture
Visualizations are built from a flexible scene graph. Points, lines, triangles, labels, cameras, groups, and plot containers can be combined into reusable components and updated at runtime.
Scientific plotting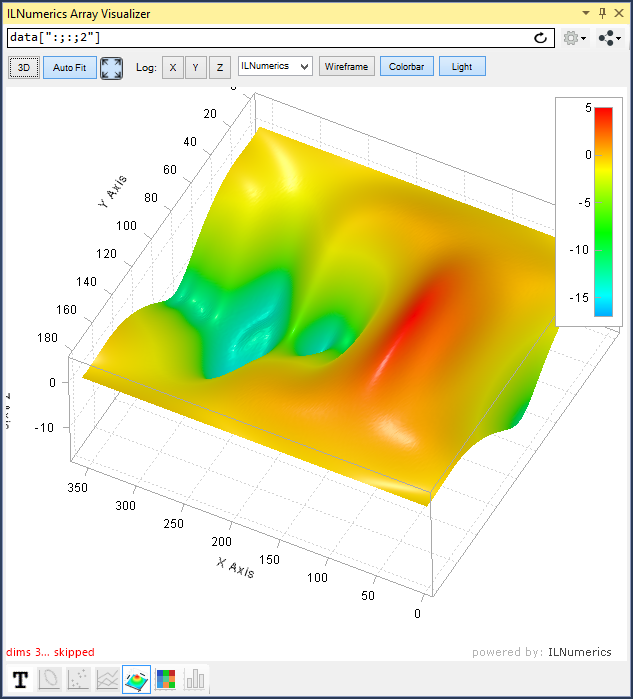
The Visualization Engine includes ready-to-use plot types for common technical and scientific workflows. Plot cubes add axes, labels, legends, colorbars, scaling, aspect-ratio control, camera interaction, and other plotting features.
Integrated data model
Rendering is tightly integrated with the ILNumerics Computing Engine. This allows numerical arrays, computed results, and visualization objects to work together efficiently without unnecessary conversion layers.
Export and publishing
Scenes can be rendered offscreen and exported to bitmap formats such as PNG, JPG, and BMP. SVG output is available for vector graphics and publication workflows.
The big picture
ILNumerics visualizations are based on a scene graph. A scene graph is a structured representation of visual objects and their relationships. Simple node types such as points, lines, triangles, and labels form the basic building blocks. Group nodes make it possible to organize objects, compose larger structures, and reuse complete visualization components.
Cameras control how 3D scenes are viewed. For technical plotting, ILNumerics provides plot containers such as PlotCube, which simplify the display of data with axes, labels, legends, colorbars, scaling, aspect ratios, and interaction.
Predefined plot types cover many common visualization tasks, while the scene graph remains open for custom graphics. More advanced plot types are available through the ILNumerics.Drawing2 toolbox.
Why it matters
Technical visualization is often part of the application itself, not an afterthought. Engineers and scientists need to inspect intermediate results, interact with models, validate algorithms, monitor systems, and explain complex data to others.
ILNumerics helps teams build these capabilities directly into .NET software. Numerical computing, visualization, interaction, debugging, and deployment can remain in one managed development workflow.