C# Plotting Library - 2d and 3d Plots: Scientific Visualization in .NET
2d and 3d Plotting is used to visualize all kinds of data for purposes like data exploration, charting, and scientific visualization. There's a lot of specially designed software for plotting around; however, plots created with this kind of software often lack both performance and portability.
Flexible C# Plots with ILNumerics
All 2d and 3d plots in ILNumerics are based on the ILNumerics Scene Graph for .NET implementation. This offers the user full flexibility to create and customize any 2d and 3d plot with C# and .NET: including Line Plots, Contour Plots, Bar Plots and many more.
Tutorial for 2d and 3d plotting in .NET
This tutorial will introduce the 2d and 3d plotting / scientific visualization capabilities of ILNumerics. Starting with an overview of the main handling of plot cubes we will demonstrate line plots and markers and how to combine and configure them. More advanced plotting objects are also demonstrated.
Learn more about the ILNumerics 2d and 3d plotting library for C# and .NET in the following chapters:
- Quick Start Guide
- Plot Cube
- Line Plots
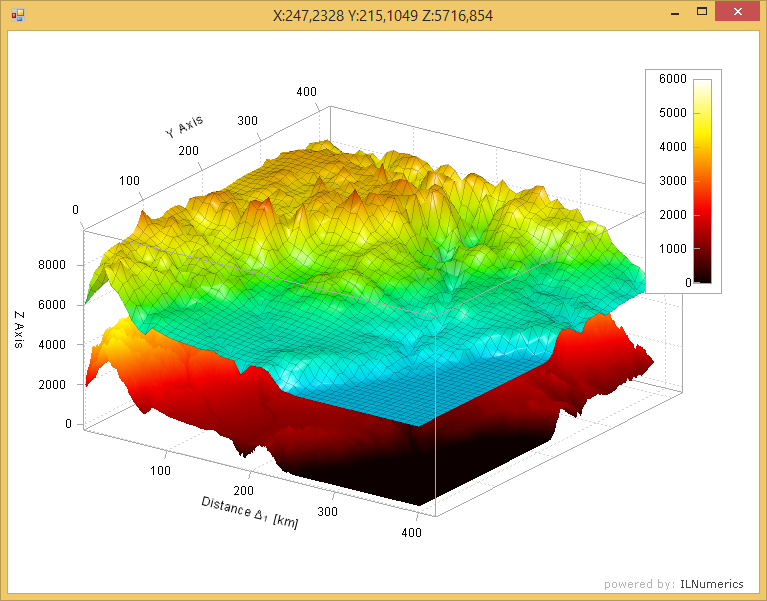
- Surface Plots
- Contour Plots
- ImageSC Plots
- Error Bar Plots
- Candle Stick Plots
- Bar Plots
- Box Plots
- Spline Plots
- more...
3d Plot in C# with ILNumerics: Example