
ILNumerics® Visualization Engine for .NET
The ILNumerics Visualization Engine adds interactive 2D and 3D graphics to production .NET applications. Build scientific plots, engineering dashboards, simulation views, data inspection tools, and custom visual interfaces directly in C#, Visual Basic, WPF, and Windows Forms.
Visualization is not just presentation. In technical software, plots and 3D scenes are part of the application workflow: engineers inspect data, validate algorithms, interact with models, monitor systems, and explain complex results. ILNumerics brings these capabilities into the same managed .NET environment as your numerical code.
Interactive technical visualization for production .NET applications.
Built for technical software teams
Many charting libraries are useful for simple 2D plots. Technical applications often need more: large numerical datasets, 3D geometry, logarithmic axes, NaN handling, dynamic updates, custom interaction, offscreen rendering, and tight integration with application logic.
ILNumerics is designed for these professional scenarios. It combines ready-to-use plotting objects with a flexible scene graph, so teams can start with standard plots and still build highly customized visual components when the application requires them.
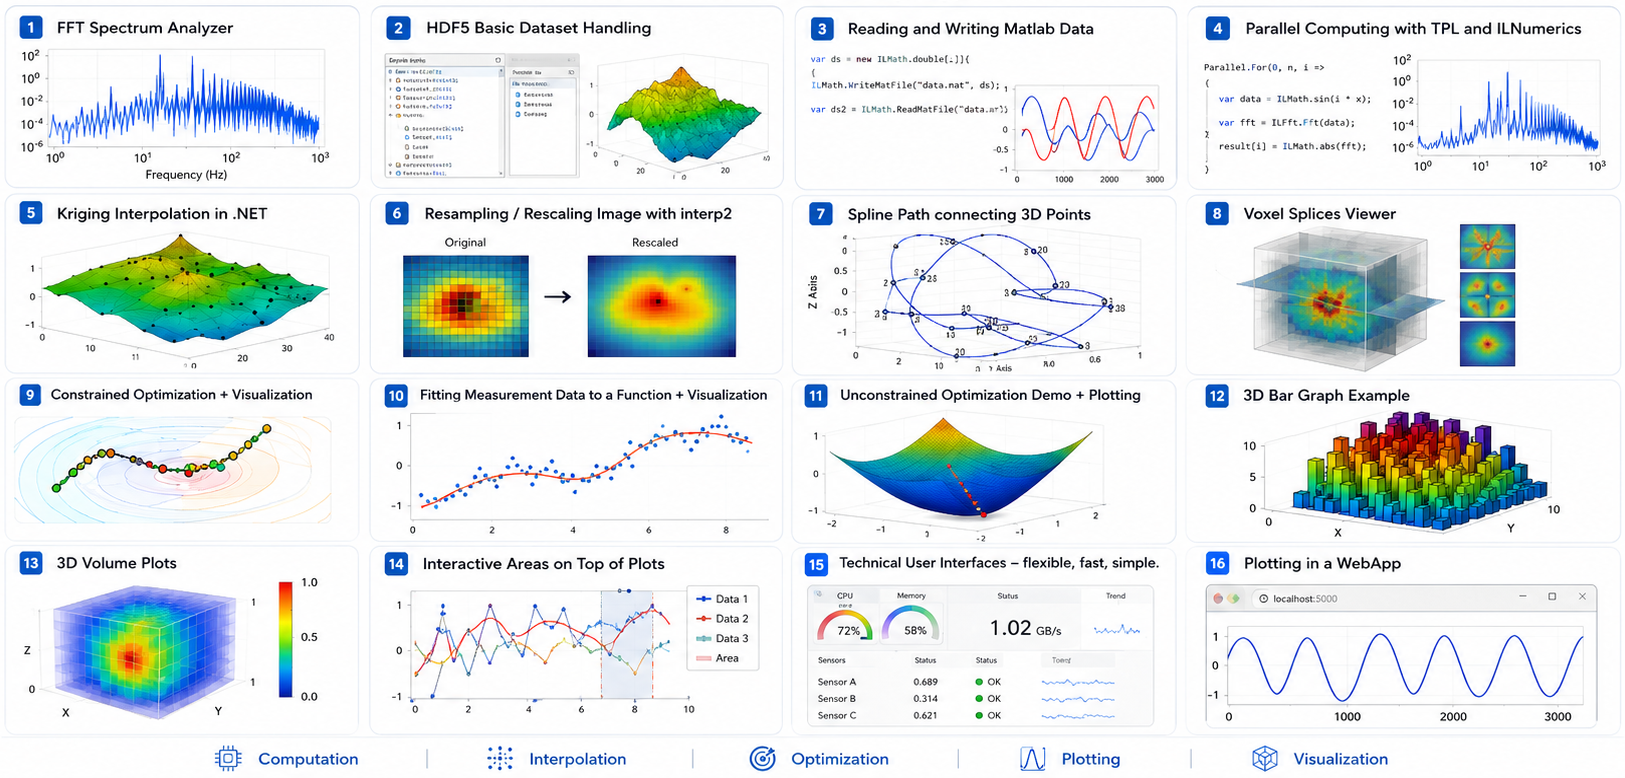
What you can build
- Scientific 2D plots, line plots, scatter plots, contour plots, and bar plots
- 3D surfaces, meshes, volumes, point clouds, and custom 3D scenes
- Engineering dashboards and interactive analysis tools
- Simulation, measurement, and industrial monitoring interfaces
- Interactive visual GUIs with picking, labeling, and object-level events
- Reusable visualization components for larger .NET applications
Scene graph flexibility
The Visualization Engine is built on a full-featured scene graph. Visual objects such as points, lines, triangles, labels, cameras, groups, plot cubes, and complete plot components can be combined, transformed, updated, and reused.
High-level objects make common plots easy to create. Low-level objects give developers the control needed for custom graphics, domain-specific visual interfaces, and advanced interaction.
Interactive by design
ILNumerics visualizations are designed for dynamic applications. Scenes can be updated programmatically, connected to live data, and controlled through mouse interaction, camera movement, picking, and fine-grained event handling.
This makes it possible to turn visualizations into application interfaces: from interactive data labeling and model inspection to fully customized 2D and 3D technical GUIs.
Integrated with numerical data
The Visualization Engine works together with the ILNumerics Computing Engine. Numerical arrays, computed results, and visual objects can stay in one managed .NET workflow, reducing conversion overhead and keeping computing, visualization, debugging, and deployment close together.
Rendering and export
ILNumerics supports hardware-accelerated OpenGL rendering, GDI+ rendering, and SVG output. Scenes can be used interactively inside desktop applications or rendered for reports, publications, documentation, and web snippets.
Why teams use it
- Build technical visualization directly into .NET applications
- Combine ready-made plots with customizable scene graph objects
- Handle 2D and 3D data in the same visualization system
- Create interactive visual interfaces, not just static charts
- Keep computing, visualization, and application logic in one workflow
- Use a mature engine shaped by many years of technical visualization projects