In the third part of our series we focus on the visualization of scientific data. You learn how to easily display your data with ILNumerics and the ILPanels.
Continue reading ILNumerics for Science – How did you do the Visualization?
In the third part of our series we focus on the visualization of scientific data. You learn how to easily display your data with ILNumerics and the ILPanels.
Continue reading ILNumerics for Science – How did you do the Visualization?
I’ve been working as a scientist at universities for 10 years before deciding to go into industry. The one thing I hated most was coding. At the end of the day coding for scientists is like running for a football player. Obviously, you need it but it’s not what you’re here for.
I really dreaded the coding and the debugging. So much precious time for something that was so clear on paper and I just wanted the solution of my equations to see whether my idea made sense or not. More often than not scientists find that their idea was not so great and now they had spent so much time coding just to find out that the idea didn’t work. Continue reading ILNumerics for Scientists – An easy start
I recently got a request for help in building an application, where ILPanel was supposed to create some plots with a dark background area. Dark color schemes are very popular in some industrial domains and ILNumerics’ ILPanel gives the full flexibility for supporting dark colors. Here comes a simple example:
2D and 3D Visualizations are an important feature for a wide range of domains: both software developers and scientists often need convenient visualization facilities to create interactive scenes and to make data visible. The ILNumerics math library brings powerful visualization features to C# and .NET: ILView, the ILNumerics Scene Graph API and its plotting engine. We’d like to give an overview over our latest achievements.
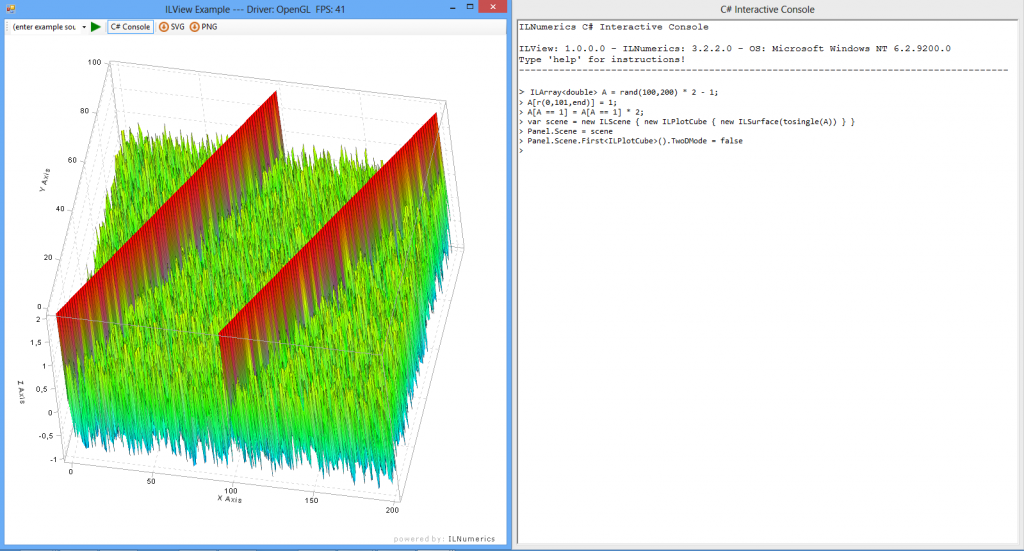
We have created ILView as an extension to our interactive web component: It allows you to simply try out ILNumerics’ 2d and 3d visualization features by chosing the output format .exe in our visualization examples. But that’s not all: ILView is also a general REPL for the evaluation of computational expressions using C# language. ILView is Open Source – find it on GitHub!

The ILNumeric’s scene graph is the core of ILNumerics’ visualization engine. No matter if you want to create complex interactive 3D visualizations, or if you aim at enhancing and re-configuring existing scenes in .NET: The ILNumerics scene graph offers a convenient way to realize stunning graphics with C#. It uses OpenGL, GDI, and it’s possible to export scenes into vector and pixel graphics.

With ILNumerics’ visualization capabilities, C# becomes the language of choice for scientists, engineers and developers who need to visualize data: Our plotting API and different kinds of plotting types (contour plots, surface plots etc.) make easy work of creating beautiful scientific visualizations.

It seems that we’re facing a trend at the moment: scientific computing, math and visualization software for web browsers. With our interactive web examples we have taken a step into that direction, too: Visitors of our website can change the C# code of our plotting and visualization demos in order to create a new SVG, PNG, JPG or EXE output. This allows people to easily try out the ILNumerics syntax and our powerful 2d and 3d visualization features for .NET. In addition to that, ILView allows a convenient way to interactively explore scenes that are created with ILNumerics.
There are two other web applications that cause a lot of excitement in the scientific community at the moment: The IPython Notebook and Shiny, a tool for creating web applications in R. Let’s have a closer look…
The IPython Notebook adresses the huge amount of Python users in the scientific community. It basically offers a new way for writing papers: It’s a web based editor for code execution, math, text and visualization. Because the IPython Notebook combines all parts you normally need to write a scientific paper, you won’t have to import / export different elements from several domain specific software applications: “Everything related to my analysis is located in one unified place”, explains Philip J. Guo in his blog (http://www.pgbovine.net/ipython-notebook-first-impressions.htm). Once you have finished your paper, you can share your IPython Notebook as HTML and PDF with your colleagues, your professor etc.
Shiny stands for a different approach: It allows you to implement own analysis into web applications. While IPython obviously adresses Python users, Shiny is based on R, a still very popular programming language among statisticians. What makes Shiny interesting are its interactivity features: Most demos on the Shiny website offer the opportunity to choose input parameters from text fields or drop-downs to dynamically change the output visualization. The code seems to be quite similar to R, so users who are familiar with that language will easily be able to create interactive data visualization applications for their websites using Shiny.
Both approaches make web browsers accesable for specific needs of scientific visualization: The IPython Notebook offers a convenient tool to share the results of analytics related research; Shiny allows R developers to publish particular interactive plots on the web.
However, both projects are limited – namely because of technological issues. The level of performance that can be realized with both platforms is restricted: You’ll face that at the latest when you start creating complex 3d scenes with either Python or R. This holds true for the platforms’ web applications, too…
For certain purposes web based scientific computing software offers new convenient solutions. But if you want to realize complex interactive 3d visualizations, you still won’t use any of them but an application on your local machine instead.
Our interactive web examples point the direction we want to go. In order to make scientific computing more powerful, we’re working on the next step of our approach: a full WebGL support for ILNumerics. Stay tuned…