
3D Volume Plots
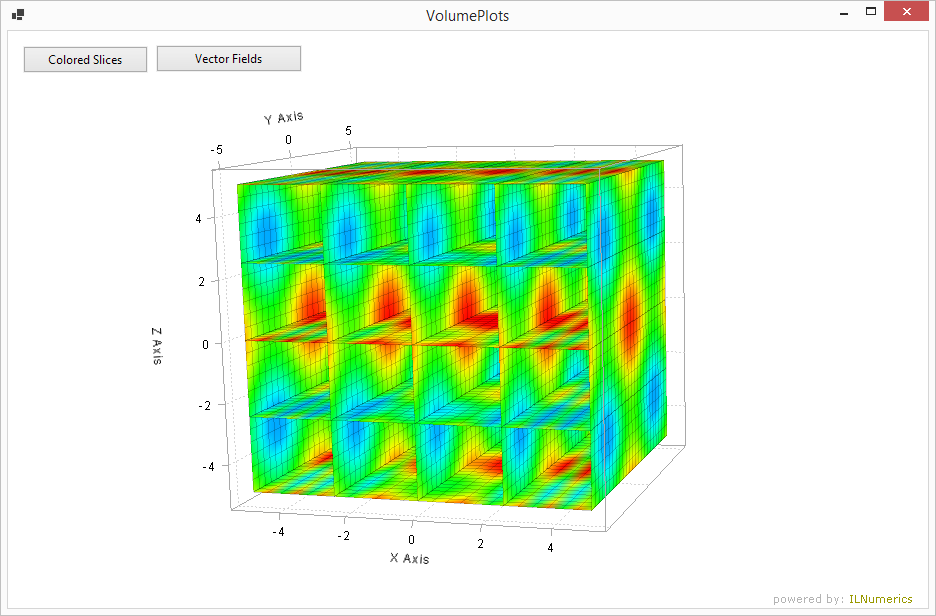
Two ways of visualizing volume data: a simple quiver-like vector plot in 3D and a colored surface plot in 3D are created. The vector plot visualizes the direction and magnitude of 3D data at the specified 3D positions. The colored surface plot map a single dimensional value at the vertices to a color. The plots focus on efficiency and can be used with reasonably large data sets.
Last modified: August 25 2021 18:29