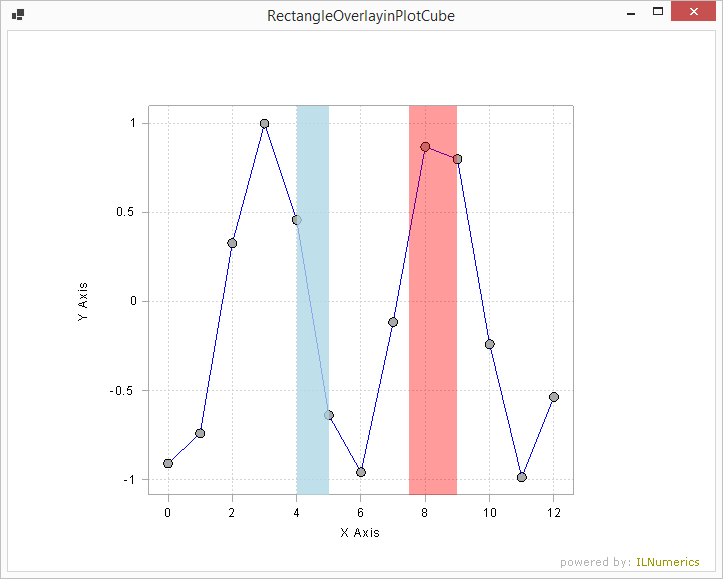
Marking Transparent Areas in a Plot

Two transparent areas are created in a line plot in order to emphasize certain regions of the plot. The area will always be transparently rendered on top of the line and markers and follow interactions by the user: panning, zoom and even rotation (for 3D plots) are supported.
Last modified: August 25 2021 18:29
