Stacking objects on top of each other

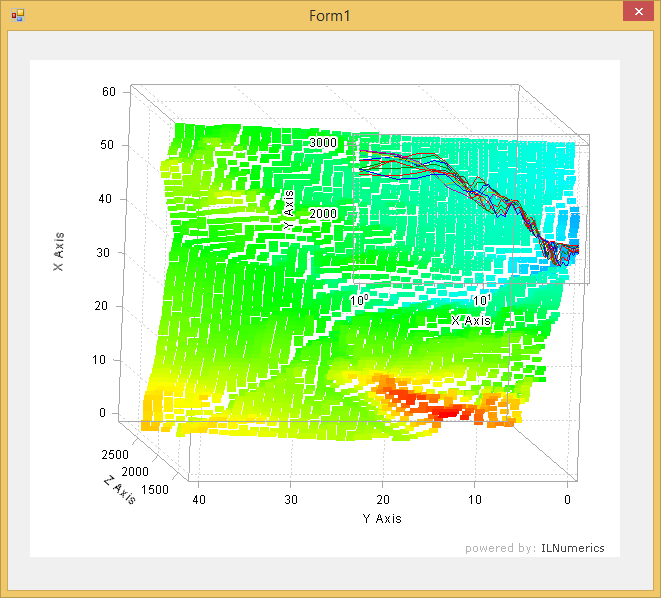
The example shows an ImageSC plot and a line plot. The line plot is rendered on top of the imagesc plot - regardless of its 3d coordinates. Interactivity is handled separately, depending on which object the mouse is currently over: when starting a drag operation over the 2D line plots a 2D selection rectangle allows to control the zoom settings of the line plot only. When starting to drag with the left mouse over the 3D plot a regular rotation operation is performed on the 3D plot only.
Last modified: August 25 2021 18:29
