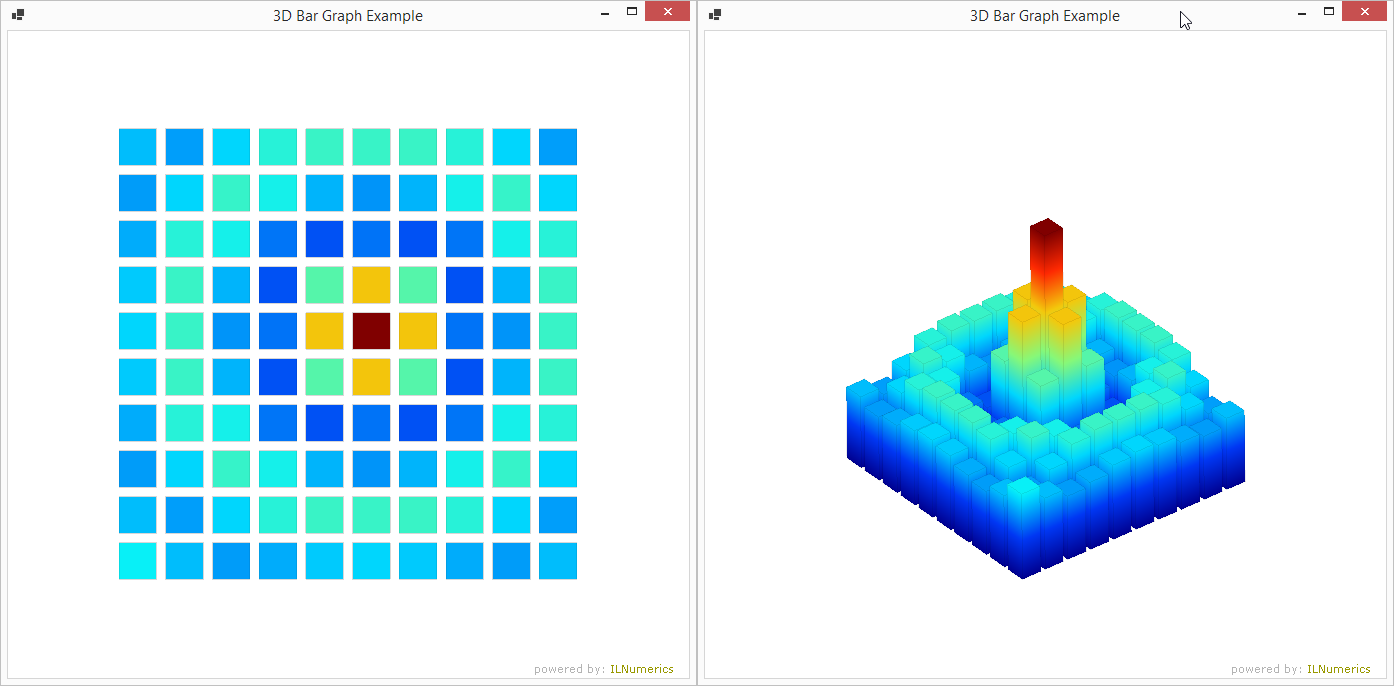
3D Bar Graph Example

Creates a simple bar plot in 3D, similar to an ImageSC plot. Each element of the input matrix creates a bar, mapping the value of the element to the height and color of the bar. All bars are created by reusing and scaling a single unit cube shape. All bar share the same set of vertex buffers. However, they are still individually configurable: here we apply an individual color to each bar.
Last modified: August 25 2021 18:29
