
Reversed Y Axis Line Plots, Custom Tick Label Styles
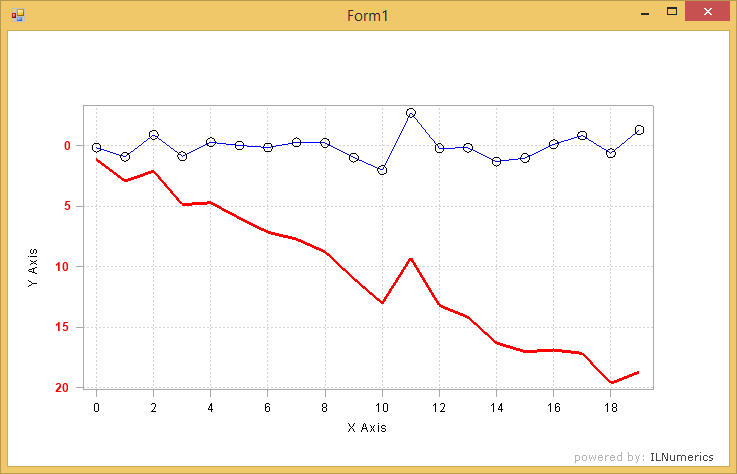
In order to reverse an axis for 2D plots one can simply rotate the plot cube accordingly. Here, in order to rotate the Y axis of a line plot, the plot cube is rotated by 180° around the X axis. The mouse double click event is overwritten in order to prevent the user from resetting the scene to the default view (upwards aiming Y axis).
Care must be taken to not only rotate the plot cube but also to translate it. The reason is that the origin of the plot cube lays at (0,0,0) - which is not centered for the plot cube. Rotating would therefore rotate the labels outside the default min / max range for the viewing frustum.
Last modified: August 25 2021 18:29