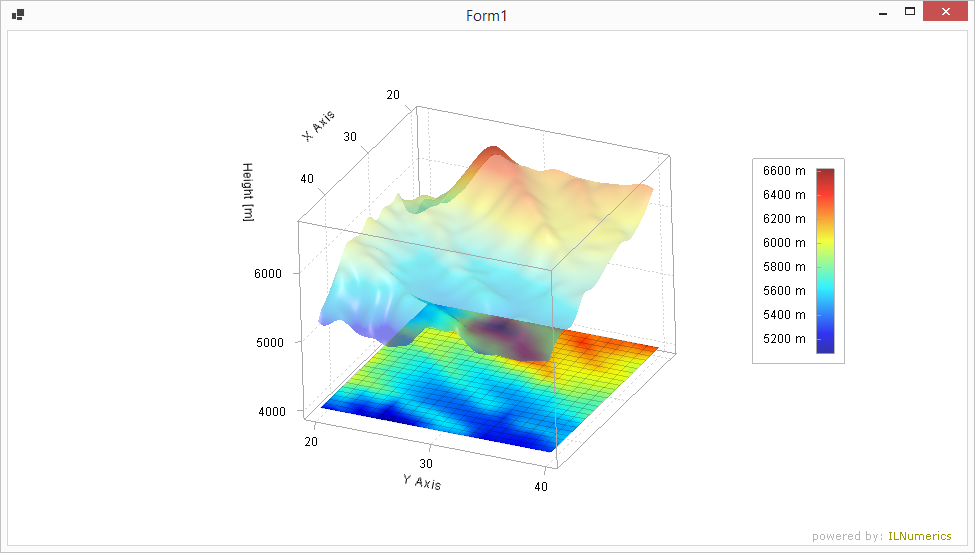
Smoothed Heightmap Interpolation in a combined, stacked surface Plot

Heightmap data 20 x 20 is plotted as a flat, colormap encoded surface in its original resolution. A smoothed version of the data is computed via 2D spline interpolation, using Interpolation.interpn(). A second surface plot is created based on this smoothed height data and plotted in the same plotcube stacked on top of the flat original data.
The example also demonstrates several configuration options: the plot cubes Z label is repositioned and the text for the label specified. A colorbar is added to the scene and its labels are postfixed with a string showing the scale unit. Colormaps are selected for both surfaces. The surface with the smoothed data has specular lighting enabled.
Lesson: Make the smoothed surface transparent and hide its wireframe. Watch the scene from a 2D view. Double clicking with the mouse resets the scene to a 2D view. This creates an overlay over the original data with 'new' information showing details between the original grid points.
Last modified: August 25 2021 18:29
