
Colormapped 3D Bar Plots using ILBarPlotEx (from v4.10)
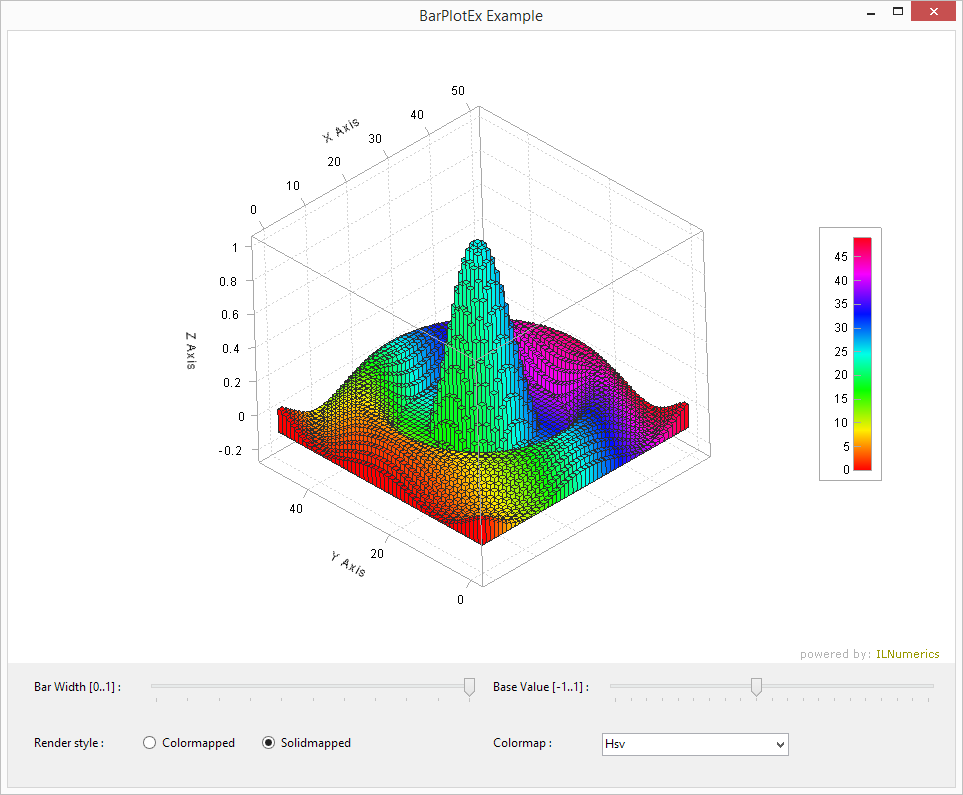
An example application demonstrates the using of ILBarPlotEx for meshgrid data visualisation. A sample dataset could be defined as vector, 2D matrix or 3D matrix in meshgrid format and visualized like bar plots. An each visualized bar plot is colormapped according to their height. Try to change the plenty of parameters by several buttons and check boxes provided. The ILBarPlotEx object supports two color modes: solid color mapping(over X axis) and colormapped(over Z axis).
Use the track bar to change parameters and see the difference!
Last modified: August 25 2021 18:29