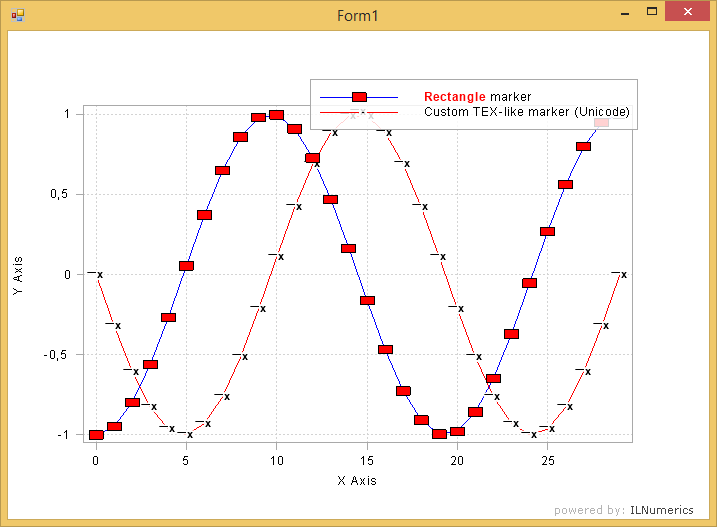
Custom Legend Example

Two line plots are created and a legend is configured for them. The legend displays a small example of the actual line plot, including markers. For the label of the lines flexible tex expressions are utilized. Legends are screen objects: one can drag them with the mouse at runtime.
Last modified: August 25 2021 18:29
