
Auto Resolution
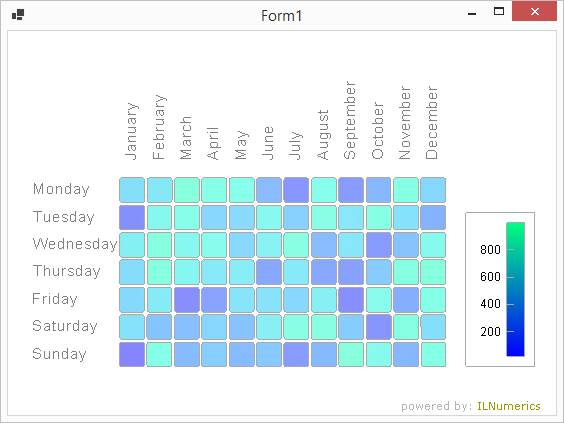
The following example shall demonstrate the creation of a colormapped matrix chart. While the columns indicate weekdays, the rows represent months. A third parameter that is linked to the weekdays and months. Its values are indicated by different colors. Step by step it is shown how the squares and labels are created. Furthermore, information on colormapping is included.
Last modified: August 25 2021 18:29