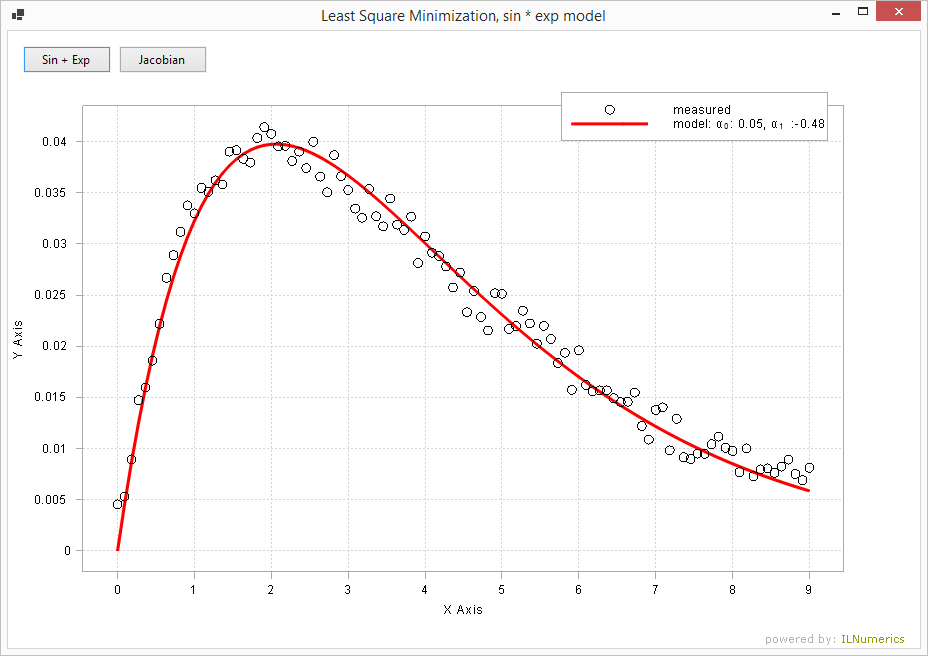
Fitting Measurement Data to a Function + Visualization

Explains how to use the ILNumerics Optimization Toolbox in order to fit a nonlinear model to measurement data using least squares. Another example uses a similar approach to minimize the Beale function in two dimensions. Both, the source data and the fitted function are plotted together using ILNumerics Visualization engine.
This example is accompanying material for the online documentation for nonlinear least squares solvers.
Last modified: August 25 2021 18:29
