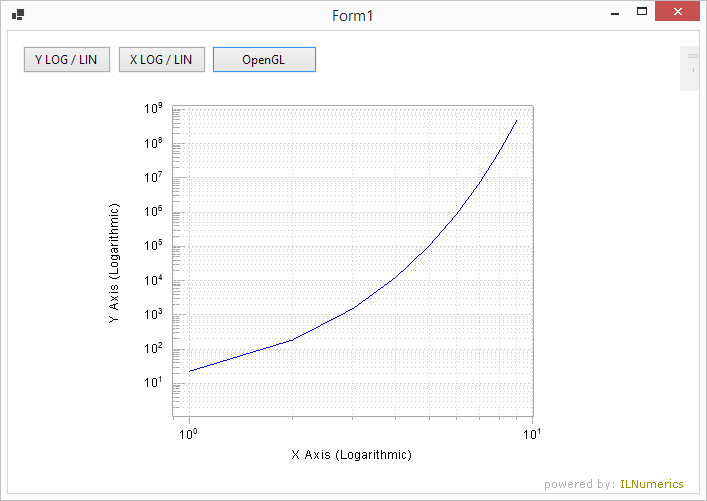
Interactive Axis Configuration: Logarithmic Scales

Three buttons allow to configure this simple line plot at runtime: switching logarithmic / linear scales for X and Y axis individually. The third button switches renderer (OpenGL / GDI) on the fly. Both renderer produce equivalent results.
Last modified: August 25 2021 18:29
