
Bar Plotting (2D and 3D) using ILBarPlot (from v4.10)
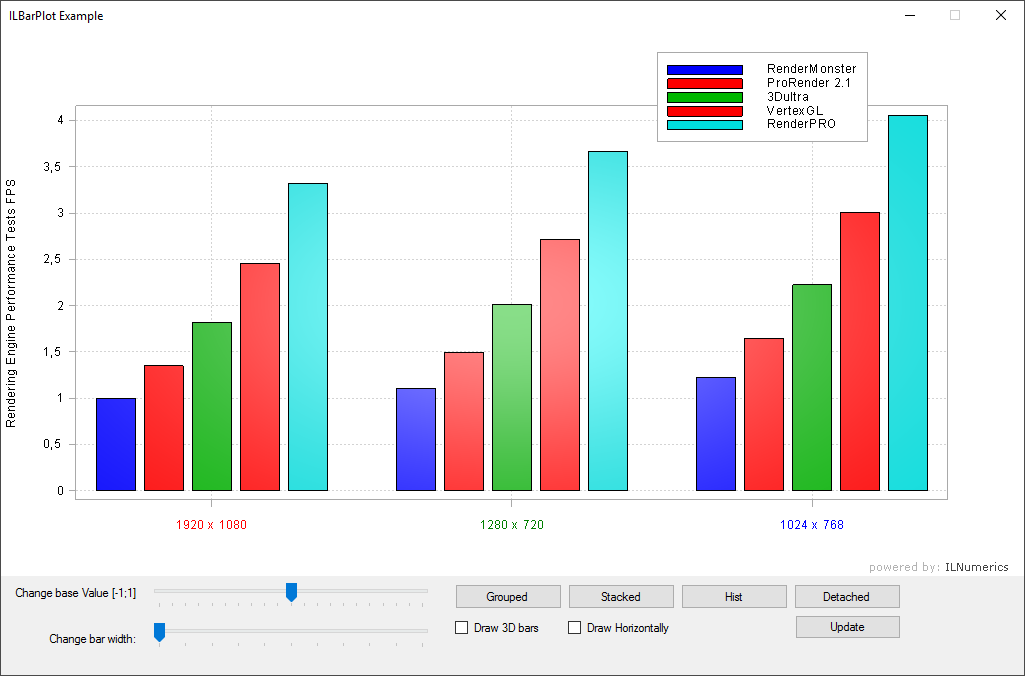
An example application demonstrates how to use and customize bar plots. A sample dataset is defined as matrix and visualized as BarPlots. Try to change the plenty of parameters by several buttons and check boxes provided. The ILBarPlot object allows to configure the color for individual bars and bar groups.
Use the track bar to change parameters and see the difference!
Last modified: August 25 2021 18:29