
3d Visualization basics part i
This section deals with the customization and combination of ILNumerics 3D shapes.
This tutorial contains interactive web components, where you can code in C# and experiment with what you have learned. Here, you can find more information.
3d shapes
ILNumerics provides various 3D shapes, as shown in the graph below.
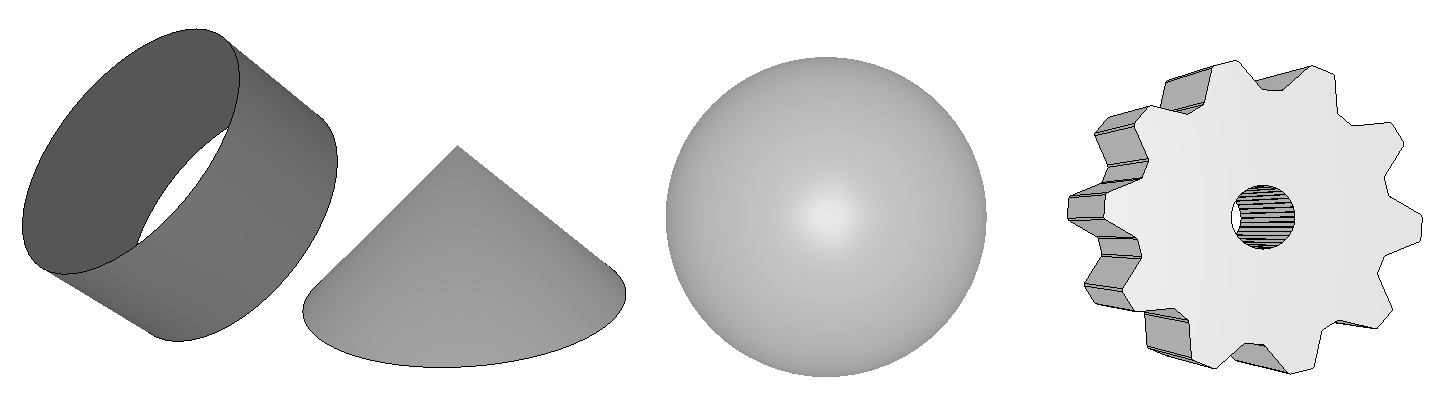
Those are based on simpler shapes, which can be accessed. As a result, ILNumerics three dimensional shapes are highly configurable. How this is done, is shown with the example of the visualization class Cylinder().
To begin with, a cylinder is created. Then its position, orientation and size are specified:
By referencing components of the cylinder such as the hull, you will gain access to its properties.
But you can even go into more detail. What if you would like to change the shape of the cylinder into a truncated cone? The cylinder is based on the visualization class TriangleStrip(). The positions of its vertices are stored in buffers. You may access the positions buffers and alter its content, as displayed in the following:
To begin with, the positions of the vertices are extracted from the positions buffers. All even columns contain the positions of vertices located at the top of the cylinder, while all odd columns contain the positions of vertices located at the bottom of the cylinder. Therefore, all even columns are multiplied by a value of 0.5. Subsequently, the positions buffers are replaced by the new values. Now, the top of the cylinder must be adjusted. For this purpose, it is also scaled by a factor of 0.5.
In this way, you may modify your cylinder or any other ILNumerics shape as much as required.
combining 3d shapes
Of course, you can also combine those 3D shapes to create a more sophisticated geometry.The following graphs both represent a laval nozzle.
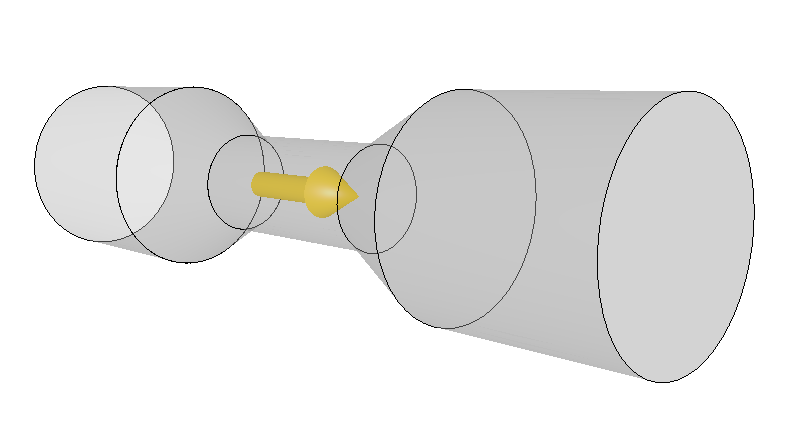
The laval nozzles from above are merely made up of cylinders and truncated cones based on the visualization class Cylinder().
Initially, the components of the laval nozzle are created and tagged. Note, that some of them are cylinder objects, while the majority of them are group objects. You will see soon why.
Next, the cylinderOpen is specified in terms of color, orientation and position.
Other components such as cylinderMiddle and cylinderClose are based on cylinderOpen due to great similarities.
The following code shows how cylinderOpen can be copied. It is then further modified.
cylinderClose, on the far right, is created in a similar way with the difference that it must not be rescaled.
Next, the truncated cone is created. The positions of its vertices are modified, just as in the example from above.
Since, two components of the laval nozzle represent truncated cones, only with different orientations, truncatedConeOpen is copied, relocated and rotated.
Finally, all objects are added to one main group called lavalNozzleStructure, allowing to freely translate and rotate the complete assembly, maintaining the inner relations.
Below you can find the complete code:
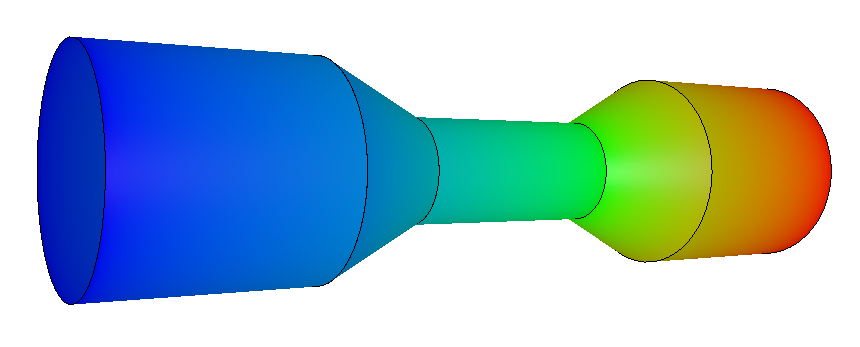
The colors in the second graph display the course of an arbitrary parameter. To begin with lavalNozzleStructure is copied and an array containing colors is generated.
Next to the positions buffers, color buffers exists. Here, the color of each vertex can be specified. To create a color gradient, the vertices at the bottom of the cylinder and the vertices at the top of the cylinder shall be of one color. As a result, there must be an array containing 50 times one color and 50 times the other color.
This procedure is repeated for every component, resulting in the following code:
Note, how we made use of the tags that were determined above.