
Special features of ilsplineplot
The purpose of this tutorial is to take a closer look at certain features and requirements of the interpolation toolbox with the example of the high-level visualization class SplinePlot. Furthermore, this tutorial will help you get a better understanding of how scene rendering in ILNumerics works, enabling you to correctly implement functions inside the rendering process.
SplinePlot’s main function is to immediately deliver a smooth line based on any given 1D, 2D or 3D dataset of arbitrary size. For this purpose, the dataset is spline interpolated for a specified resolution. The resolution indicates the number of additional data points between two original data points. To get a satisfying result, the user must adjust the resolution according to the nature of the data.
This can be a very cumbersome process, because how is the user supposed to know what a suitable resolution is before even seeing the plot? In the worst case, the user will have to go back and forth adjusting the resolution. One might think that the work is done now, but what if the user decides to maximize the output window or zoom in to take a closer look at a particular area of interest? Unfortunately, in most cases this again will result in a rough line. Now, some might suggest to set the resolution to the highest value possible. However, imagine the dataset is huge. A great resolution value will eventually have an effect on the performance. Consequently, the user will have to wait for a long time to see the results and won’t be able to smoothly interact with the plot.
SplinePlot with a resolution of 4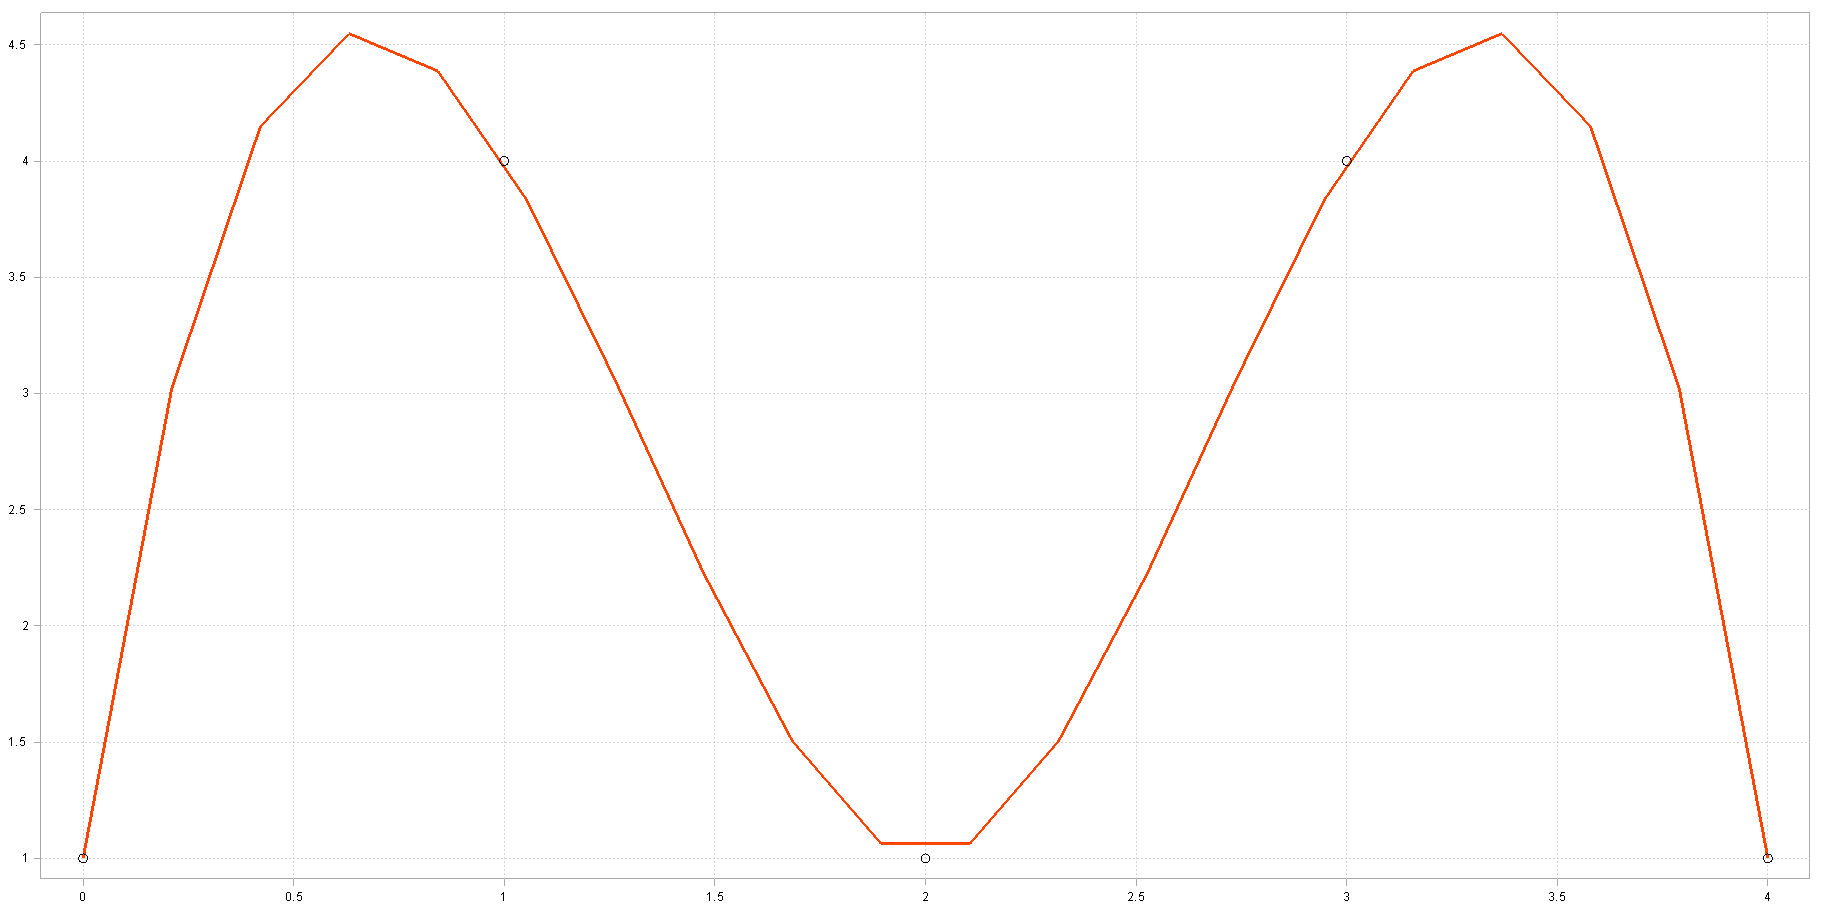
SplinePlot with a suitable resolution of 20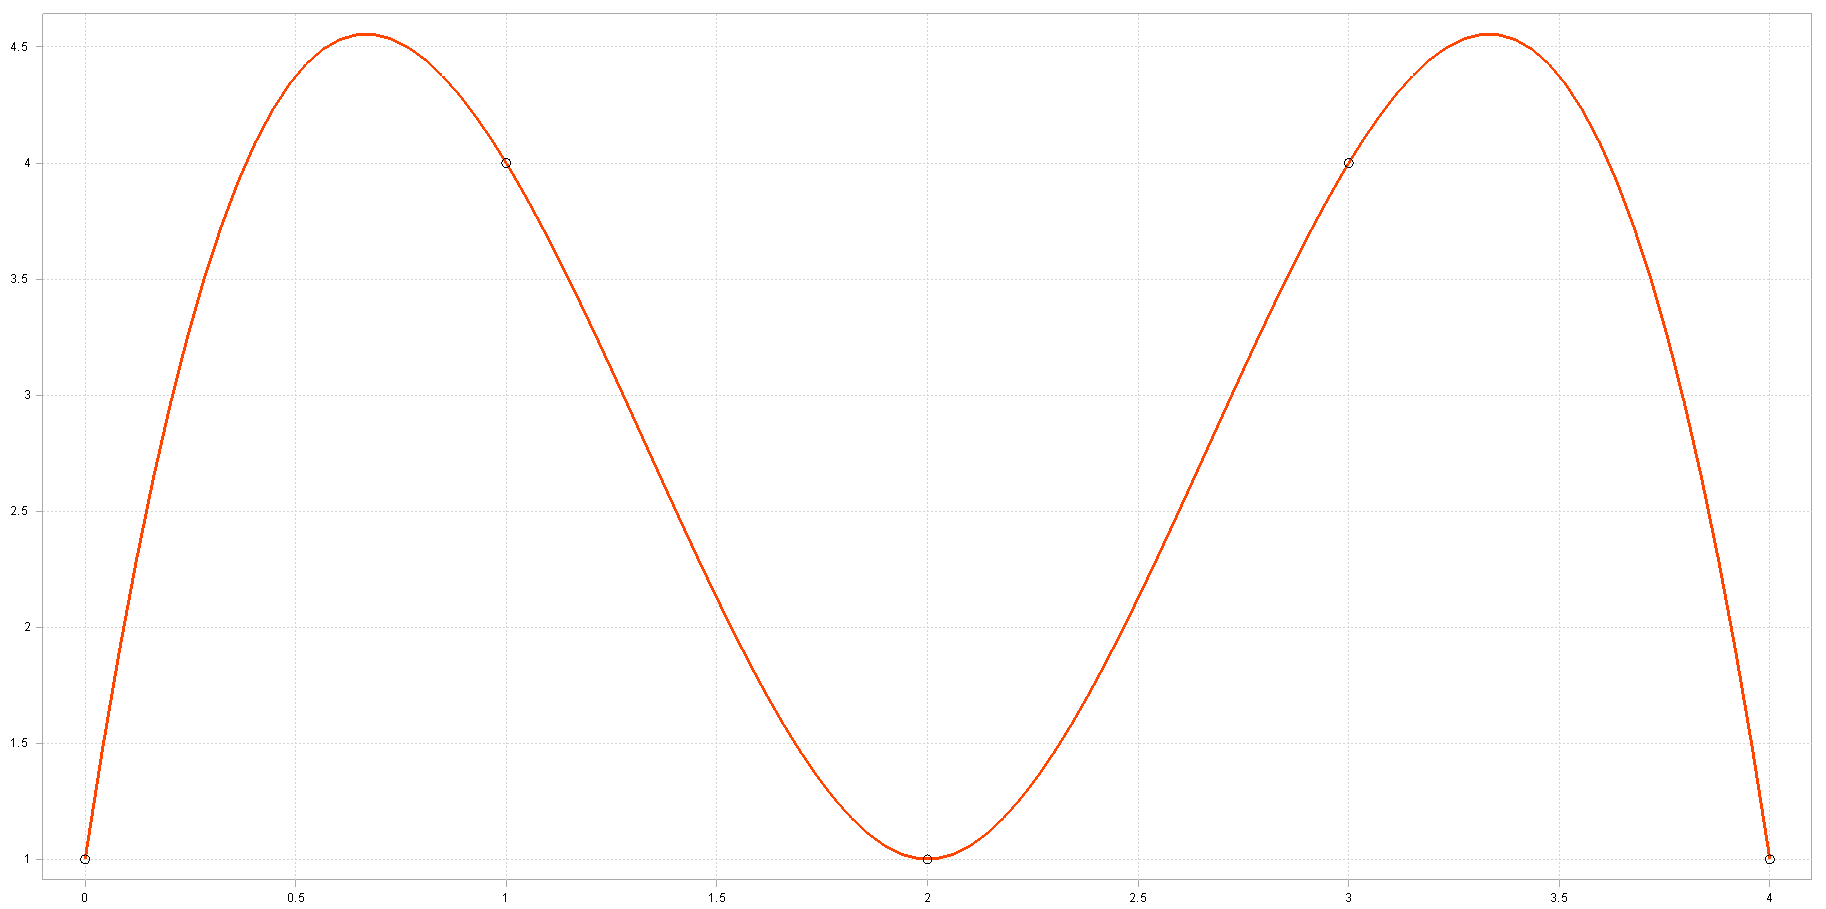
maximized ilsplineplot with a resolution of 20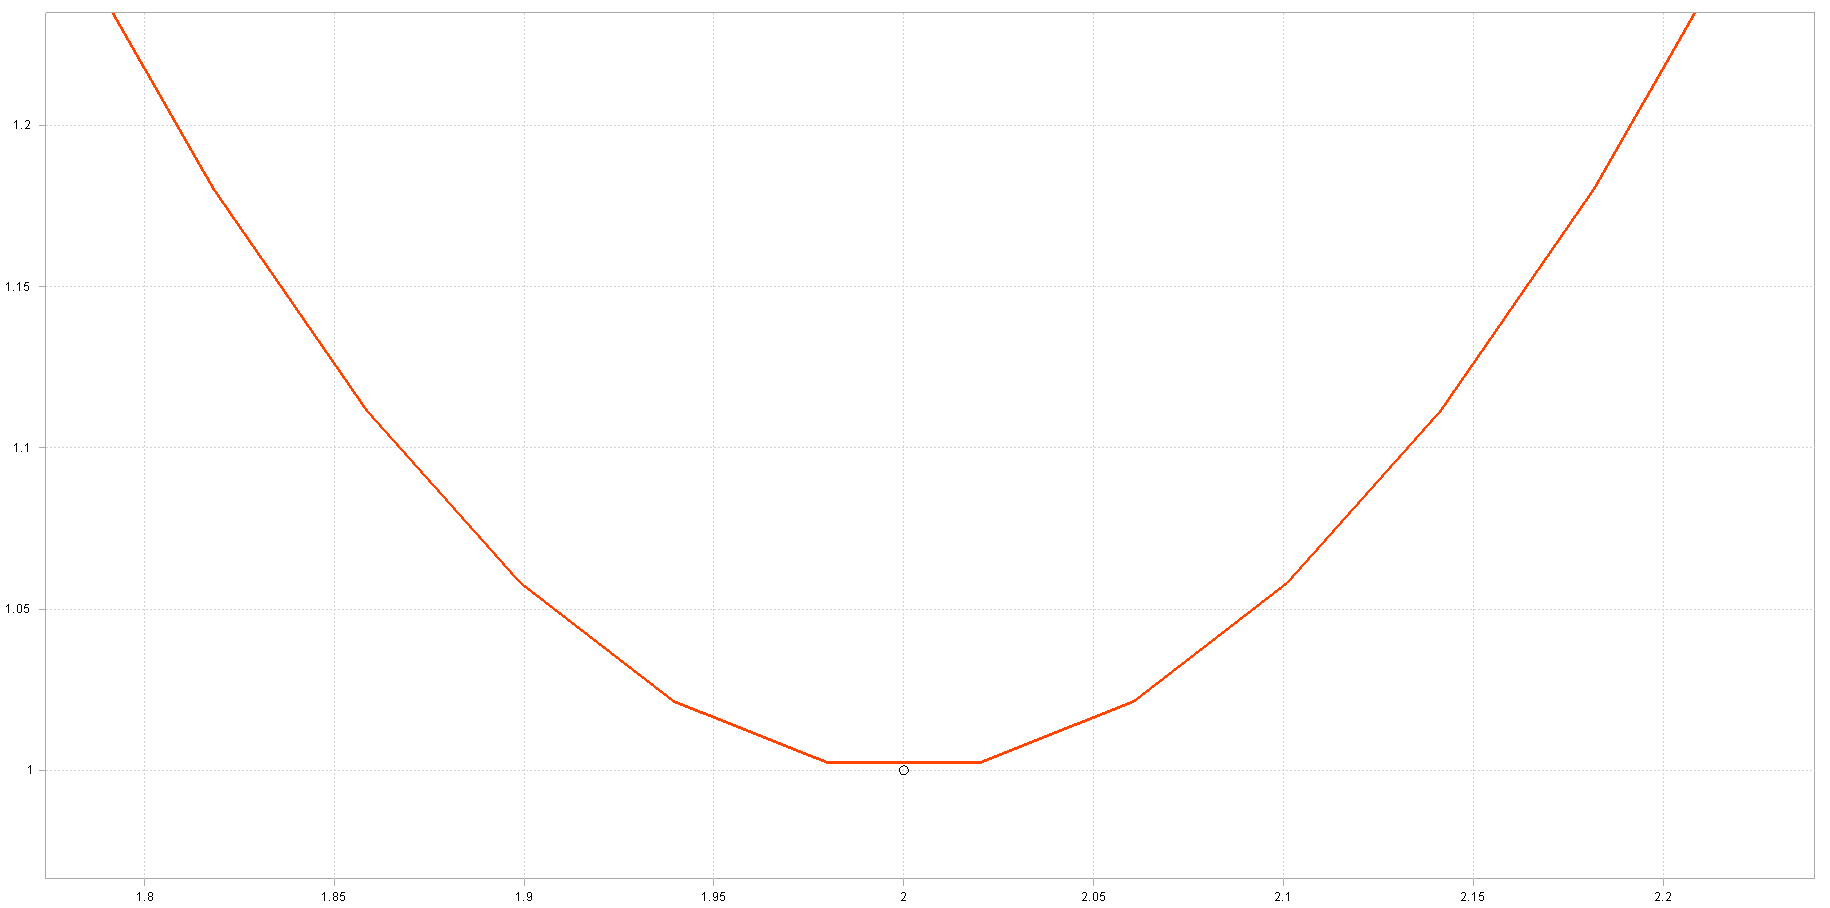
To solve this problem, we decided to implement auto resolution, a function that automatically adjusts the resolution according to the nature of the given data and the current view (output window size and number of visible data points). To obtain the current view, it is necessary to look into the rendering process.
In the following, we will first take a look at the interpolation calculation and the possibly necessary data preprocessing. Afterwards, we will go into more detail with the rendering process.
Interpolation
The ILNumerics Interpolation Toolbox enables to interpolate data of any dimensionality. The user can choose between different methods such as linear, cubic, spline and many more. As the name implies, SplinePlot is based on the spline interpolation.
Data Preperation
In order to apply the built-in spline interpolation, the underlying data cannot contain any NaN values. Consequently, they must either be removed or replaced. But, first of all they need to be detected as shown below:
To detect NaN values the built-in method isnan() is applied, yielding a logical array, in which the value 1 indicates NaN values. By applying the built-in method find(), we can obtain the indices:
Since the rows of an array must have the same number of columns, each column containing a NaN value must be removed. Therefore, only the column indices are of interest.
But what happens if after removing the critical columns, the number of the remaining columns is less than 4? As a consequence, the spline interpolation cannot be applied, since it requires at least 4 data points.
With the example of a one dimensional array of data points, we will show how they can be replaced, in order to maintain the original number of columns.
Before the NaN values are removed, a copy, yNaNRemoved, of the array yOriginal is created. Furthermore, the regularly spaced vector xOriginal and its copy xNaNRemoved are generated. xOriginal ranges from 0 to the length of yOriginal. In the next step, the NaN values are detected and the corresponding columns of yNaNRemoved and xNaNRemoved are deleted. Both are then used to perform a linear interpolation.
The advantage of the built-in method interp1() is that you can pick the interpolation method. So if more than 4 data points are left after removing the NaN values, you can use the spline or cubic interpolation method to compute the missing data points more accurately.
Interpolator object
As mentioned before, the user can choose between different built-in interpolation methods such as interp1() and spline(). All of these methods internally create an interpolator object that performs the actual interpolation calculation. Afterwards, the interpolator object and intermediate results are disposed. If one wants to perform a few interpolations based on the same dataset, it makes sense to directly create an interpolator object to increase efficiency.
The code above shows how, in this case, a spline interpolator object is created. Later, the method apply() is called to compute a spline interpolation.
Scene rendering
In ILNumerics the visual output is described by scene objects inside a scene. Scene objects can be different shape and plot types such as SplinePlot and are usually derived from the class Group. A particular driver (e.g.: GDI, SVG) renders the scene including its scene objects to a specific target (e.g.: PNG, SVG, Windows.Forms). Every driver maintains its own copy, the synchronized scene, of the so called global scene. Every time the global scene changes, its copies are synchronized by internally calling the built-in method Synchronize().
Targets such as Windows.Forms allow for user interaction such as panning, zooming and changing the size of the output window. Those actions are only applied to the synchronized scene, triggering its rendering process once more.
This comes in very handy for us, since we are interested in determining a suitable resolution for SplinePlot and the subsequent spline interpolation in dependency of the current view. As a consequence we must place our computations inside the rendering process. During the rendering process each scene object must be “visited” to obtain required information such as position, size, color and transparency. For this purpose, the driver calls the built-in method BeginVisit(), as the name suggests, this happens at the beginning of each renderer step. We decided to overwrite BeginVisit() and place our computation there. At this point, we are directly inside the rendering process and information about the current view is available.
For demonstration purposes, only the influence of the window size on the resolution and thus, subsequent spline interpolation is shown in the example below:
First, the current window size is obtained. It is then used to compute the resolution. The relation between the window size and resolution is indicated by the square root function. On the basis of the resolution, the spline interpolation is performed. Since a spline interpolator object was created beforehand, we can provide a vector calculated on the basis of the resolution and call the method apply().
m_autoResolution and m_resolution both have the prefix m, indicating member variables. m_autoResolution is true, if the user wants the resolution to be computed automatically. If not, the user has to provide a value for m_resolution inside the SplinePlot constructor. To make m_autoResolution, m_resolution and the interpolator object available during the rendering process, one has to overwrite the built-in method Synchronize().
But also remember, even if m_resolution is changed in BeginVisit(), as done above, it will be always changed back into its original value defined in the global scene, since we are working on the synchronized scene. In our case the resolution for m_autoResolution equals true, therefore it is computed again for each time the scene is rendered.
As you can tell, both ILNumerics Interpolation Toolbox and scene rendering offer many possibilities. This tutorial was supposed to give you an idea of what you could do. You can find more detailed information on the following pages: