
FORTRAN LIVE Debug Data Plotting
ILNumerics Array Visualizer is an interactive, graphical debug tool for Visual Studio. During your debug session it connects to the Visual Studio debug engine and allows immediate insight into the data of your program. Arbitrary array data are plotted in various, interactive chart styles: as 1D and 2D line plots, scatter plots, bar plots, as 3D surface plots, and images. Easily describe the data via arbitrary expressions. Export data in a large number of external formats, including charts, HDF5 and Microsoft Excel. Follow your data with each debug step to quickly find bugs in the algorithm.
The Array Visualizer works for Visual Studio debug sessions in C/C++, FORTRAN (ifort), C#, F#, and Visual Basic. This manual was specificly designed for users of the Visual Studio Intel FORTRAN compiler extension. Make sure to consult the language specific manuals for other languages or visit the general Array Visualizer documentation for more details.
Quick Start
1. During your Visual Studio debug session go to VIEW -> Other Windows -> Array Visualizer.
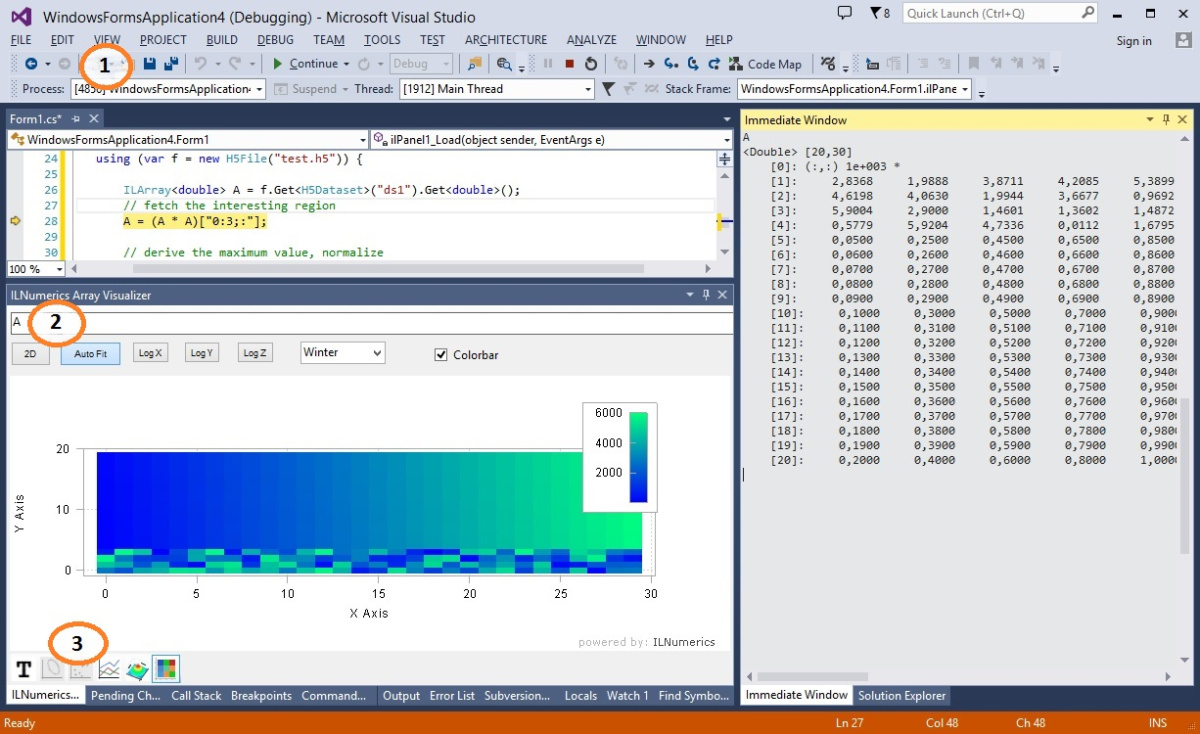
2. Enter your expression into the textbox of the Array Visualizer Window.
3. Select the output type from the list of available 2D and 3D plots.
Plotting Array Expressions in FORTRAN
Let's start by creating a very simple FORTRAN program:
The content of the variable A at the current statement is plotted by entering 'A' into the Array Visualizer and pressing [Enter]. The array descriptor kicks in and ask to enter the dimension length:

Currently, we need to enter the lenghts of the dimension manually (here: 5) and press Enter again:


Getting Interactive
No matter, how you interact with the data in your debug session – changes will show up immediately in the array visualizer. One might set the 3rd element of A to the value 10 in the immediate window. See how the plot follows:

Supported Array Expressions in FORTRAN (ifort)
In FORTRAN the LNumerics Array Visualizer plots arbitrary expressions yielding the following array types:
- FIXED length arrays of type INTEGER, REAL, COMPLEX, and CHARACTER
- ALLOCATABLE arrays
- Arrays of derived custom types
All primitve numeric element types are supported:
| Floating point data types | REAL(8) | REAL(4) |
COMPLEX(4) |
COMPLEX(8) |
| Integral data types | INTEGER(1) | INTEGER(2) | INTEGER(4) | INTEGER(8) |
| CHARACTER |
Expression entered in the Array Visualizer are evaluated in the context of the current debug stack frame. Your program must be halted in debug mode. Any valid FORTRAN code can be used as expression for the Array Visualizer, including variables, function calls etc. Basically, everything what would be accepted for evaluating in the Immediate Window is likely to work in the Array Visualizer also.
N-D Array Plotting Example
Handling matrices and arrays with more dimensions works in the very same way, except that this time we have to specify both dimension lenghts, separated with comma: "2,4": 
Plot Types
Next to the text output, the 2D matrix B can be visualized by help of the following chart types:
| XY-Line Plot | Scatter Plot | Rows Plot |
 |
 |
 |
| Surface Plot | ImageSC Plot | Bar Plot |
 |
 |
 |
The row of iconized buttons on the bottom side of the the Array Visualizer tool window represents individual plot types. Each plot provides a different view of the data. Read more
Advanced FORTRAN Visualizations
Using Array Descriptors in FORTRAN
In the previous sections of this manual, the data to plot were represented as full dense array variables. However, many technical applications implement more complex data storage scenarios. In most situations, the interesting data are stored within recordsets, or structs of more complex, 'derived' data types.
Example: potential data type definition for storing 3D measurement data.
Here, 5 data elements of type double are stored for each measurement: the X,Y, and Z coordinates as the position of the measurement and two arbitrary data values. Data1 and Data2 might be used to store the actual value measured or some error range / confidence information computed for the measurement or any other useful value.
In real world applications data structures like this are very popular. Working with them can be cumbersome, however, especially if the number of measurements grows high. Developers often enough end up inspecting individual fields of every single measurement, utilizing data tips in Visual Studio:

Now, the ILNumerics Array Visualizer simplifies things significantly. All we need to do is to provide some 'meta data' about our Measurement[] array. Recall the memory layout of the measurement data, here starting at address 0x02DE28A4:

We enter the following expression into the Array Visualizer expression textbox: myData(1).X. I.e: we point to the first field (X) of the first element in the myData array. The Array Visualizer will automatically determine the element type of X. When pressing Enter it kicks in and asks for more details:

Additional details in the Array Visualizer are provided by means of array descriptors. One simple way of looking at the data is to consider them as a 5 x 9 double matrix. This can be achieved by providing the dimension lengths '5,9' to the array descriptor and pressing enter:

More array descriptor trickery allow us to pick individual elements from the struct array and have them plotted in various ways:

This plots the Data1 and Data2 members as line plots in the same scene. The array descriptor collects the two 'array' line data for Data1 and Data2 into a matrix with the following properties:
- 2 rows of 9 elements each, row 1: Data1; row 2: Data2.
- Element type is double.
- Data1 and Data2 are located by the striding information: element spacing between Data1 and Data2 members are 1 for the same measurement. Individual mesurements have an element spacing of 5 double elements.
- Data extraction starts at the first Data1 element (offset: 3).
Read all about array descriptor syntax here.
Let's create another example for our measurement data by visualizing the positions (XY coords) of the measurements. Scatter plots are useful to visualize individual data points, when the data coords come from a matrix with up to 3 rows and each column of the matrix corresponds to one data point.

This makes the 2D positions of the measurements clearly visible. We show the X-Y positions only here, since we look straight onto the X-Y plane. If there were any useful Z values we would visualize them by switching to the 3D view and rotating the plot with the mouse. Modify the original data and the array descriptor and try this yourself!
Another useful view is given by the bar plot tab. It shows the X, Y and Z coordinates as separated groups:

We could easily add both, Data1 and Data2 as new rows to the matrix / groups to the plot - this is left to the reader as exercise.
Plotting arrays of complex numbers in FORTRAN
The ability to visualize the content of arbitrary memory segments is a very useful tool. Given a pointer to the data it lets us pick the interesting parts from your debug structures and visualize them in intuitive ways.
One more example of this convenience is given by arrays of COMPLEX numbers.
Entering C and pressing [CTRL + ENTER] brings:

Just define 4,2 as the dimension lengths and hit Enter again!

All but the text output will take the real values from the complex numbers only. We can control the extracted data of the complex values and consider their Real(8) parts instead. This gives greater options to utilize all plotting outputs for imaginary numbers as well. All popular implementations of complex numbers store the data interleaved in memory: real1 + imag1 + real2 + imag2 + real3 .... a.s.o. In order to plot such data, we only need to acquire a pointer to the data array and make use of the array descriptor syntax to redefine element type, array length(s) and strides:

Here, we have reshaped the 4x2 complex array to a 4x2x2 REAL(8) array, the real values are in the first 4x2 slice, imaginary values are in the second 4x2 slice. We could want to plot real and imaginary values as individual lines or as XY lines and achieve this by the following array descriptor / plot settings:
 |
 |
For extracting the real parts only:

The imaginary parts only can be extracted by this:

Read more:
- Array descriptor tutorial (mixed languages)
- Array Visualizer overview