
Histogram in .NET (C# and Visual Basic)
With the histogram functionality you can collect data in separate bins. There are four histogram options available. The regular histogram routine will just collect the data in the bins. Values returned reflect the absolut number of data occurrences found inside a matching bin.
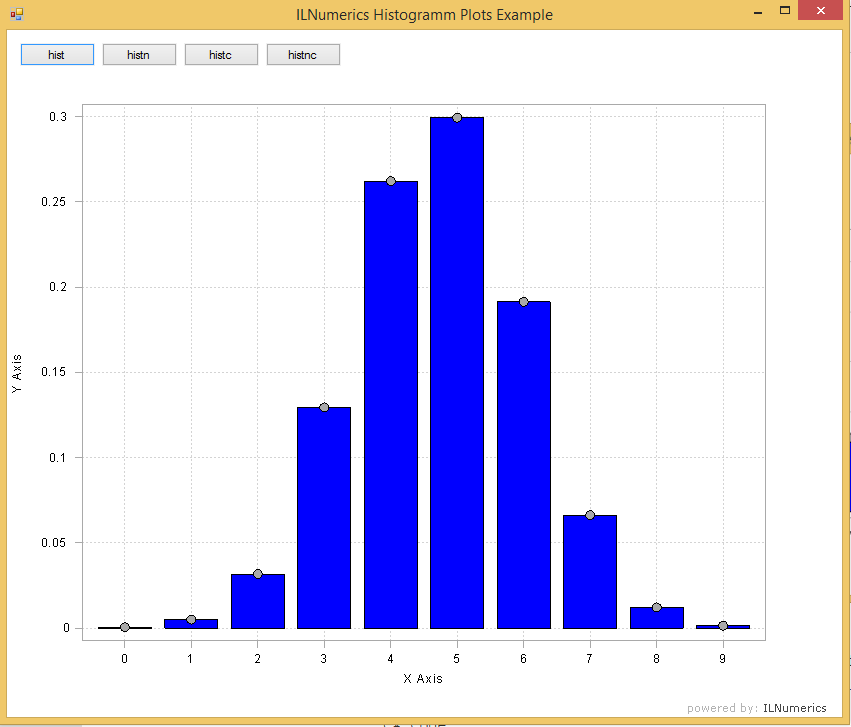
For 10.000 random values a plot of the result may looks as follows: 
The normalized histogram gives the values normalized with respect to the number of data points. This basically resembles the probability of finding a data point in a given bin.
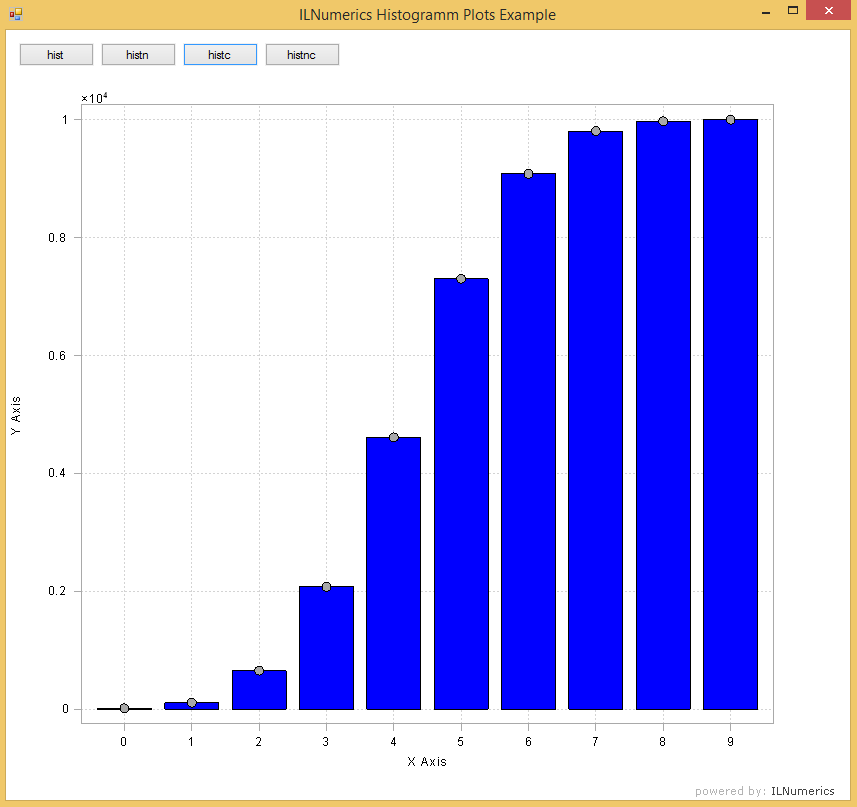
The cumulated histogram gives the sum of all data points in the previous bins and the current. Consequently, the final bin will have a value equal to the total number of data points
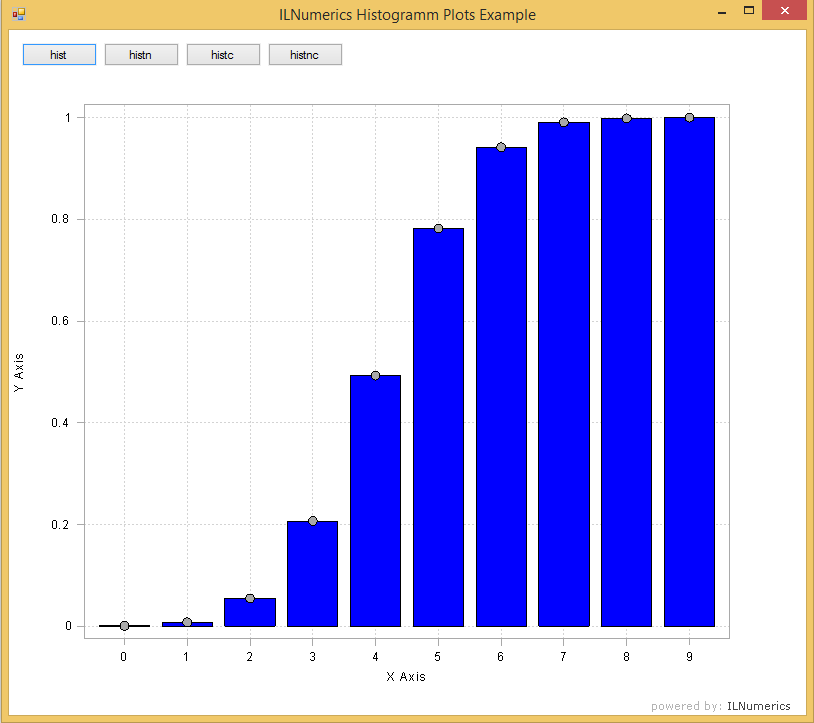
Finally, there is a normalized and cumulated histograms. It combines the effect of normalized and cumulated histograms. As a result the value for the final bin will always be 1.
See also:
Download the complete example for generating the plots above.
Apidoc reference documentation for hist, histc, histn, and histnc.