
Axis Configuration
On this page you'll learn more about:
- Accessing Axes
- Axis Main Label Configuration
- Ticks Configuration
- Grid Lines
- Logarithmic Scales
- Multiple Axes
Axis objects are used to visualize value ranges of the X-, Y- and Z directions within a plot cube. Per default, one X axis, one Y axis and one Z axis are created. Every axis is able to display:
- An axis main label (e.g. „X Axis“ in former examples)
- A number of tick marks at convenient value positions within the axis range,
- A tick label next to every tick mark,
- A grid line around the back edges of the plot cube for every tick mark and
- A scale label, displaying the exponent of display values, if the tick labels are abbreviated for visibility reasons.
The configuration for axes – especially for 3D plots – can get cumbersome. Therefore, ILNumerics provides useful default values for:
- The position and direction of the axis. By moving a plot cube in 3D mode, the plot cube automatically determines comfortable axis positions for best visibility.
- The position, orientation and anchor of the axis main label. The main label will always follow the position and direction of the axis itself and is never hidden by any tick labels.
- The number and the positions of the tick marks along the axis range.
- The text, orientation and anchor of the tick labels.
- The style of the grid lines.
Each of these settings can be overwritten – often individually. This means, by explicitly setting – let’s say - the position of the main axis label, all other settings keep getting determined automatically, even the orientation, rotation and the anchor of the main label.
However, for most flexible configuration tasks, the whole axis can be customized. The following example shows a custom main axis label and custom settings for texts, positions and rotations of the tick labels for the X axis. All settings will be discussed in the rest of this section. The code used for configuration:
Accessing Axes
All axes objects belong to the special group node PlotCube.Axes. The collection provides shortcuts for the default instances of X-, Y- and Z-axes. If more than one axis object exists for an axis type, those axes are accessed by the regular group node access methods (See: Accessing and managing Accessing and Managing Nodes of Groups).
Axis Main Label Configuration
The main label for an axis is a common label object, supporting all common label features: arbitrary angle, simple TeX expressions, individual character styles and flexible anchor positions (See: Labels).
However, a plot cube axis adds some properties to take its dynamic character into account. During mouse interaction by the user, PlotCube automatically determines the best position and orientation of the axis. Depending on which edge of the plot cube the axis is currently drawn, the position, anchor and rotation for the axis main label are also adjusted permanently.
Nevertheless, manual control of an axis main label is possible by using the following optional properties of Axis.
Label Positioning
Since for 3D plots, the position of an axis may change permanently due to mouse interaction / rotation of the plot cube, no absolute value can be used to determine the position of the axis label. Therefore, the setting is done relative to the current axis position and orientation by help of Axis.LabelPosition.
The position of the labels anchor point is determined by giving coordinates in a coordinate system which moves with the main axis line. The origin is located on that end of the main axis line where the lower range limit starts. The X coordinate of Axis.LabelPosition gives the position of the main axis label along the main axis line: 0 corresponds to the end of the axis where the lower limit starts. 1 corresponds to the end with the upper limit. The default value for the X coordinate is 0.5. This places the label in the center of the axis.
The Y coordinate of Axis.LabelPosition determines the position of the label in perpendicular distance away from the axis main line. 0 corresponds to the center of the main line. 1 corresponds to the distance just autside the tick labels region. Perpendicular means: perpendicular in screen space. Away means: in direction away from the center of the cube. The default value for Y is 1.
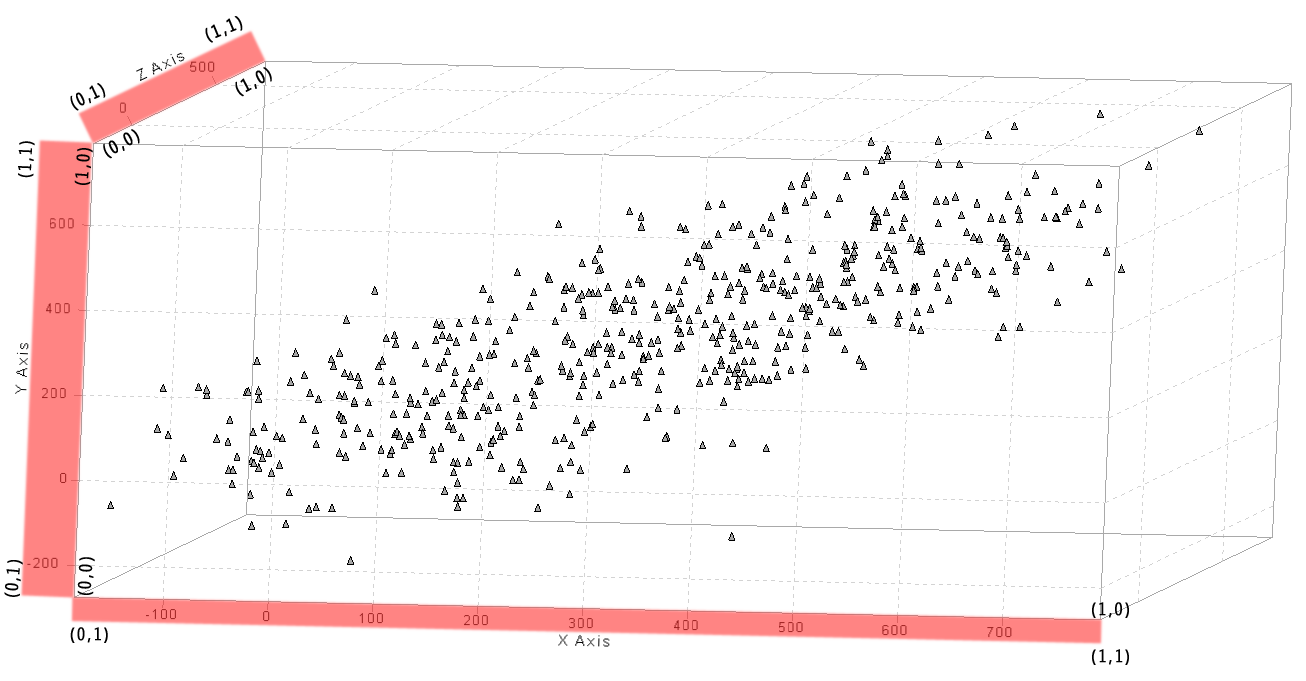
The above figure shows the area for each axis in red, which corresponds to label position values in the range from (0, 0) to (1, 1). Note that the range of the X coordinate in the label position tupel does always start at the lower axis limit. 1 for the Y coordinate varies with the current orientation of the axis, since the relevant size of the tick labels varies as well. The tick labels for the Y axis in the figure use significant more space than the tick labels for the X axis. In order for the main label to always start directly outside of the tick label area, it is sufficient to give it a Y coordinate value of 1 (default).
The Z coordinate of the Axis.LabelPosition property is ignored.
LabelAnchor, LabelRotation
Setting the Axis.LabelAnchor or the Axis.LabelRotation properties explicitely will prevent the label from automatic settings during mouse interactions. The properties correspond to the common meanings for the Label.Anchor and Label.Rotation (See: Labels).
The X axis label is directly positioned at the end of the axis main line (X = 1, Y = 0). The LabelAnchor property places the labels anchor point at the center of the right edge of the labels rendering area. and therefore moves the X axis label right to sit vertically centered on the main axis line.
The Y axis label is also positioned at the end of the Y axis main line (X = 1, Y = 0). The LabelAnchor is set at the vertical center outside of the labels rendering area (X = 1.2, Y = 0.5) and the label is rotated by pi/4 around the anchor point.
Ticks Configuration
Ticks for axis are mostly created automatically. The ILNumerics plot cube provides a useful choice of ticks with corresponding labels in most situations. For advanced customization scenarios, ticks are fully configurable.
Ticks Creation Modes
Ticks for axis are automatically created by default. This corresponds to the Mode property of axis Axis.Ticks collection being set to TickMode.Auto. For TickMode.Auto custom configurations are possible still. The collection of ticks is automatically determined and updated once the cube was changed interactively. However, most important parameters are nevertheless configurable via two function parameters (see below). Configuring the ticks in TickMode.Auto brings the advantage that the ticks are still automatically adapting to interactive plot cube manipluations; an especially useful feature for interactive, rotating 3D plots.
In order to allow complete custom configuration of the ticks (number, positions, labels, styles), Axis.Ticks.Mode is set to TickMode.Manual. In manual mode, the collection of axis tick labels is not changed by the plot cube – no matter how the cube is affected by interactions. In this mode, the user is responsible for the complete configuration of all ticks parameters.
Auto Ticks Configuration
Two functions determine the creation of ticks: TickCreationFunc and LabelTransformFunc. TickCreationFunc is used to determine the positions of ticks. LabelTransformFunc creates the label expression for a tick. Both functions have default values, which may are used by custom implementations.
TickCreationFunc – can be overwritten with a custom function. It is called on every frame while the axis is prepared for rendering. The function expects 3 parameters: Min (float), Max (float) and Count (int) for the minimum and maximum range of the axis and the suggested number of ticks to be created. A custom implementation might look as follows:
At first, the default creation function is called in order to create all regular ticks. Afterwards, the current maximum of the Y values from the line plot is computed and used as new tick position. This takes the option into account, that the line plot might get altered dynamically; hence the maximum is repeatedly computed. A simplyfied implementation would compute the maximum once and reuse it on every frame. The maximum is added to the default tick position values and the collection is returned.
LabelTransformFunc – transforms the tick position into a label expression. This is helpful to configure the size or the style for individual labels. Here, we use it to color that label red, which corresponds to the maximum value:
The following example shows custom implementations for both functions in the context of a dynamic line plot. The plot gets its Y values changed every 100ms. Hence, the maximum(s) change(s) permanently and the ticks are constantly following. A tick label is added at each maximum point on both, Y axis and X axis:
The example configures the X axis to add ticks for those points which equal the maximum Y position. Since more than one point might match the maximum, ticks for all those X coordinates are added in a foreach loop. For the Y axis, a tick is added for the maximum value. Here, only one such tick exists. We then use a custom LabelTransformFunc to color the extra tick at the maximum in red. The suffix „color{red}“ is added to the string representation for the tick value. For all other ticks, DefaultLabelTransformFunc is used (See: Tex Expressions for Labels ).
Styling Tick Labels in Automatic Mode
In order to style automatic tick labels the Axis.Ticks.DefaultLabel property is used. It allows the configuration of all common label properties for all tick labels which are automatically created and maintained by the axis. In order to set the tick labels to a bold font and give them a red color, one can utilize the following example code:
Manual Ticks Configuration
In order get complete freedom on how ticks are created, styled and updated, the Axis.Ticks.Mode is set to TickMode.Manual. Afterwards, the Ticks collection will not get altered by the axis and must be configured with custom ticks. One consequence of the complete freedom is that in manual mode all parameters for all ticks must get configured manually. In Auto mode, even custom ticks will still follow changes for the plot cube orientation and rotation and get automatically oriented and repositioned. In Manual mode, the user must configure everything herself. Especially for interactive 3D plots, one therefore may prefer TickMode.Auto.
Since in manual tick mode the collection of ticks for an axis does not change - even as the result of user interaction - individual ticks can get accessed by their index in the Axis.Ticks collection.
Scale Labels
When the range for an axis addresses very small or very large numbers, the tick labels get abreviated and scaled up or down accordingly to improve the readablility of the display. The scaling factor is then shown at one end of the axis by Axis.ScaleLabel.
The position and anchor of the scale label gets managed automatically by ILNumerics and adopted during user interaction. Other properties are freely configurable by the user.
In order to control the position and anchor of the scale label, Axis provides the following additional properties:
Axis.ScaleLabelPosition - if set - is repsonsible for positioning the scale label relative to the current axis position and orientation. For plot cubes which are interactively manipulated by the user, scale labels follow their axis constantly. The value for ScaleLabelAnchor is interpreted in the same way as for Axis.LabelPosition.
Axis.ScaleLabelAnchor - if set - is repsonsible for positioning the scale label relative to the current scale label anchor point. The value for ScaleLabelAnchor is interpreted in the same way as for Axis.LabelAnchor.
Grid Lines
Every axis is able to draw two grid line types for every tick along the axis: Major Grid Lines and Minor Grid Lines. Grid lines run along those edges of the plot cube, which are in the back regarding to the observer. I.e., grid lines are always drawn behind plot cube content and help increasing the readability of the axis scale.
Major grid lines are created by default. They correspond to every major tick in the Axis.Ticks collection.
Grid lines are regular lines, hence are configurable in the same common ways for all lines in ILNumerics. In order to make the Y axis major grid lines appear dashed in red:
Plot cubes are well prepared to handle grid lines in 3D mode. In the next example, a scatter plot is created and the grid lines are altered for the X and Z axes. (Experiment with style settings in order to find a nicer theme!)
The major grid lines for the X axis are made transparent blue, for the Z axis a custom scaled pattern is applied. Note the initialization of the Points shape with C# 3.0 object initializers: ILNumerics arrays are directly assignable to all buffer properties (Position, Color, Indices and Normals). This option exists in addition to the common Buffer.Update() functions and is convenient for the creation of new shapes.
Logarithmic Scales
Plot cubes are able to render their content either linearly or in a logarithmic scale. In ILNumerics, plots are organized by Data Groups. An arbitrary number of Data Groups may exist in a plot cube. Each hosts an arbitrary number of plots. The setting of the ScaleModes property determines the scale mode for all plots in a data group. PlotCube.ScaleModes provides a shortcut for the scale setting of the first data group in the cube and all plots contained in that first data group correspondingly.
Note how negative values are ignored for logarithmic scaling!
The scale mode affects all objects added to the corresponding plot cube data group: arbitrary lines, shapes, plots, label positions etc. One example of a surface plot in 2D mode with logarithmic scale:
It is valid to use 3D objects with logarithmic scales as well. Once we switch to 3D mode, we can apply logarithmic scaling for the Z axis also:
Again, negative values are ignored and corresponding facets are not drawn.
Logarithmic scales are able to handle lighting.
Note: In order to set the scale mode for individual objects within the same plot cube individually, one can add and use multiple plot cube data groups. (See: Advanced Configurations )
Multiple Axes
Arbitrary numbers of axes can be hosted within a plot cube. Each axis is associated with a plot cube data group (See: Advanced Configurations).